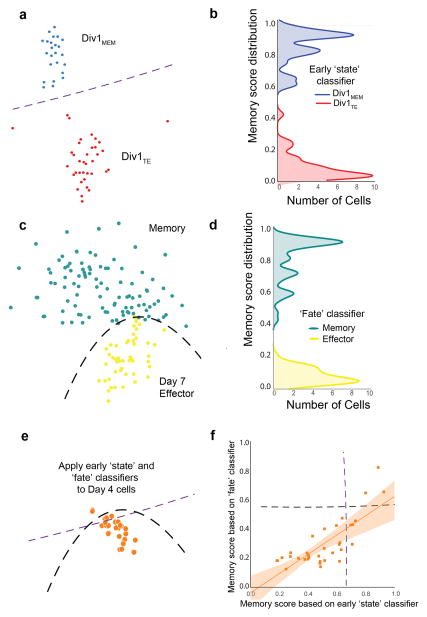
Figure 3.
Generation and application of early ‘state’ and ‘fate’ classifiers to predict the identity of cells in intermediate states of differentiation. Early state and fate classifiers learn differences in the gene expression signatures of early memory-like cells (Div1MEM) versus early effector-like cells (Div1TE) identified in Fig. 2a and Day 7 effector cells versus memory cells, respectively. (a, c) Schematic representation of Extra Trees Classifier (ETC) that separates Division 1 lymphocyte clusters (Div1MEM, blue, n=24; Div1TE, red, n=36) (a) and Day 7 effector, yellow, n=48 versus total memory cells, teal, n=96, including TCM cells (n=48) and TEM cells (n= 48) (c). (b, d) Kernel density histograms of cross-validated scores on Division 1 CD8+ T lymphocytes (b) and Day 7 effector and memory CD8+ T lymphocytes (d) from which early state and fate classifiers were trained, respectively. (e) Schematic representation of applying early state and fate classifiers to predict the fate of individual Day 4 CD8+ T lymphocytes, n=34. The black and purple dashed lines indicate the boundary between predicted memory-like or effector-like Day 4 cells. (f) Prediction analysis of individual Day 4 CD8+ T lymphocytes as measured by (e). Memory score distribution of early state classifier (x-axis, 0=effector to 1=memory) versus memory score distribution of final fate classifier (y-axis, 0=effector to 1=memory). Squares represent individual Day 4 CD8+ T lymphocytes. Early state and fate classifier scores correlate well in both linear (Pearson: r=0.78, p=4.8 × 10⁻⁸) and monotonic sense (Spearman: r=0.71, p=2.2 × 10⁻⁶). The dashed black and purple lines indicate the fate classifier’s decision boundary between memory and Day 7 effector cells. The orange line indicates the early state classifier’s decision boundary between Div1MEM and Div1TE cells. Both of these lines are stylized estimates of the real decision boundaries, which are complex piecewise-linear functions and can be much more furrowed. The orange shaded area around the linear regression line indicates the 95% confidence interval assuming Gaussian error.

