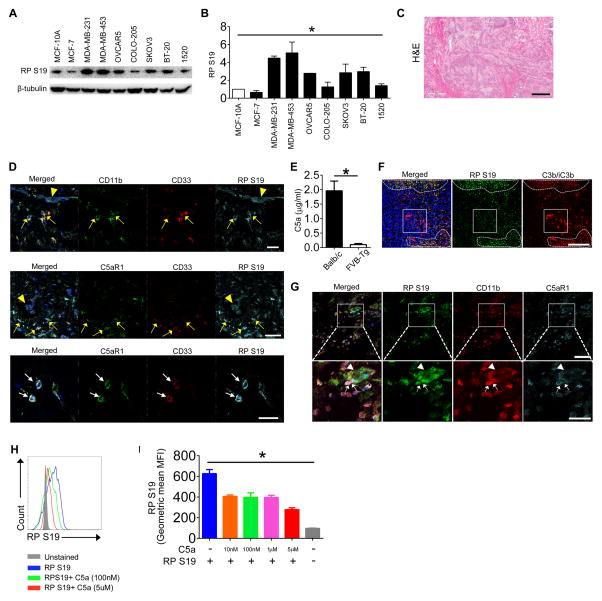
Figure 1. RPS19 is overexpressed in breast and ovarian cancer cells and interacts with C5aR1 in the interface between tumor and MDSC.
(A) RPS19 (16kD) is overexpressed in breast (MDA-MB-231, 354 and BT-20) and ovarian (OVCAR5 and SKOV3) cancer-derived cell lines relative to normal mammary gland epithelium (MCF-10A) (B) Quantification of data from A normalized to β-tubulin. *P<0.0001 by One-Way ANOVA. (C) Hematoxylin & eosin (H&E) staining of the section of tumor from breast ductal adenocarcinoma patient. The entire section contains only tumor tissue. Scale bar-500μm (D) Confocal microscopy analysis of human MDSC (CD11b+ CD33+), RPS19 and C5aR1 in breast cancer section shown in C (arrowheads-tumor cells, yellow arrows-MDSC, white arrows C5aR1 and RPS19 colocalization on MDSC). Scale bars 50 (two upper panels) and 10μm (lower panel). (E) C5a in plasma of 4T1 tumor-bearing BALB/c and NT-5 tumor-bearing FVB/N Her2/neu transgenic (FVB-Tg) mice. *P=0.0006 by t-test (F) RPS19 and C3 cleavage fragments (C3b/iC3b) deposition in mouse 4T1 tumor. Dash lines-areas with abundant RPS19 accumulation. Square-prominent C3 fragments’ deposition that does not colocalize with RPS19. Yellow inside dash outlines in merged images-RPS19 and C3 fragments’ colocalization. Scale bar-200 μm (G) RPS19, CD11b and C5aR1 in 4T1 tumors. The square outlines area, which is magnified in a lower panel. Arrowheads-tumor cells. Arrows-CD11b+ myeloid cells expressing C5aR1, which colocalizes with RPS19. Scale bars 25 (lower) and 50 (upper image) μm (H) Binding of 40 nm recombinant RPS19 in the presence of increasing concentrations C5a by FACS, representative histograms, (I) Quantification of data from (H). *P<0.0001 by One-Way ANOVA. Data are representative of three independent experiments with three replicates for A, B, H and I, n=2 for C and D, and n=5 for E, F and G.

