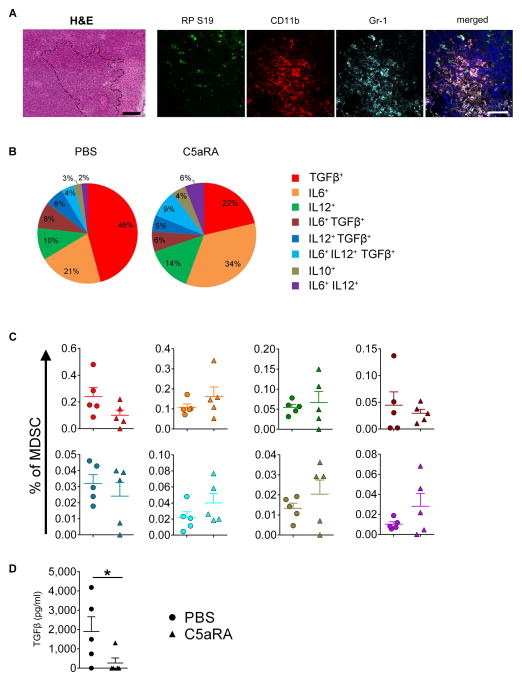
Figure 6. RPS19-C5aR1 interaction controls the cytokine milieu in TDLN.
(A) H&E of TDLN (dash lines surrounds cells with neutrophil-like MDSC morphology) and immunofluorescent detection of RPS19 in TDLN in proximity of MDSC (CD11b+Gr-1+), scale bars 100 μm for H&E and 50 μm for immunofluorescence. (B) Fractions of MDSC that produced TGF-β1, IL-6, IL-10 and/or IL-12 alone or in various combinations after ex vivo stimulation with LPS obtained from TDLN of control (PBS) and C5aR1 antagonist (C5aRA) NT-5 tumor-bearing Her2/neu transgenic mice. (C) Frequencies of MDSC producing various cytokines as in B. Legend in B applies to both B and C. (D) TGF-β1 levels in plasma of mice as in B, *P<0.0001. All statistics by t-test. Each symbol represents an individual mouse. Horizontal lines represent mean + S.E.M. Data are representative of one experiment with n=5.

