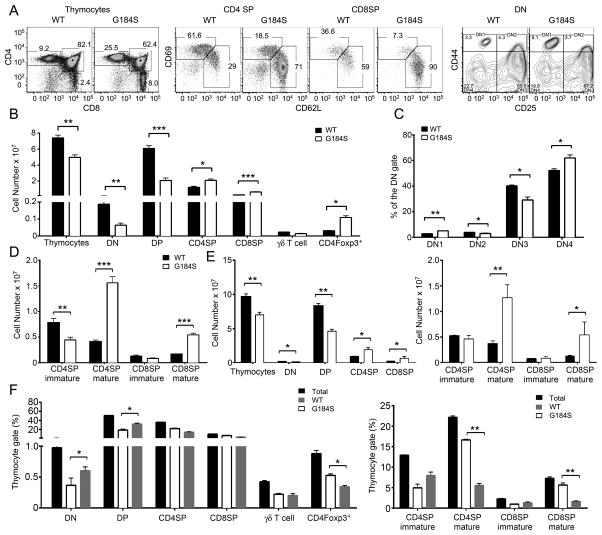
FIGURE 1.
Reduced numbers of thymocytes and altered thymocyte subsets in G184S mice. (A) Flow cytometry analyzing the expression of CD4 and CD8 on thymocytes; CD69 and CD62L on SP thymocytes; and CD44 and CD25 on DN thymocytes from WT and G184S mice. (B) Cell numbers calculated from flow cytometry results analyzing thymocytes prepared from WT and G184S mice. The γδ T cells were CD3+TCRγδ+NK1.1−CD11c− and the CD4Foxp3+ cells were CD4+CD8− and Foxp3+ by intracellular staining. (C) The % of DN1–DN4 cells from WT and G184S mice. (D) Number of mature and immature SP thymocytes from WT and G184S mice. (E) Cell numbers calculated from flow cytometry analyzing thymocytes prepared from mice reconstituted 6 weeks previously with bone marrow from WT or G184S mice. (F) The percentage of thymocyte populations of WT or G184S origin from mice reconstituted with a 1:1 mix of CD45.1 (WT) and CD45.2 (G184S) bone marrow. (A), n=4 vs. 4 mice, representative flow patterns (B), n=4 vs. 4 mice (C), n=4 vs. 4 mice (D), n=4 vs. 4 mice (E), n=4 vs. 4 mice (F), n=3 mice. Experiments were performed a minimum of 3 times. *p < 0.05, **p < 0.005 and ***p < 0.0005 (Student’s t-test).

