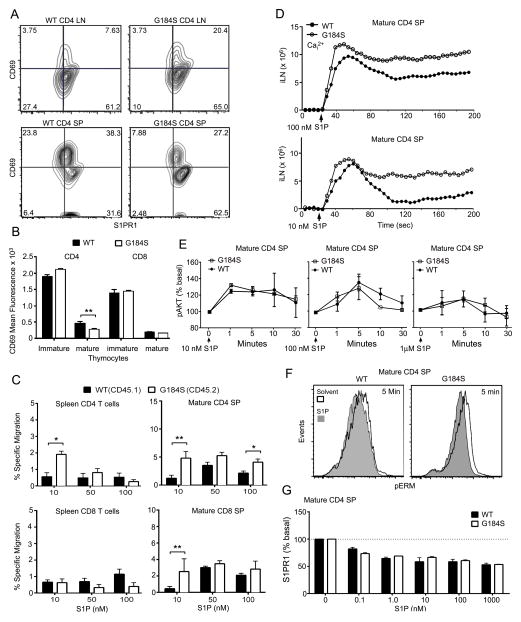
FIGURE 5.
Unimpaired responsiveness of G184S splenic T cells and SP thymocytes to S1P. (A) Flow cytometry analyzing CD69 and S1PR1 expression on lymph node CD4+ T cells and CD4+ SP thymocytes from mice reconstituted with either WT or G184S bone marrow. (B) Quantification of flow cytometry results showing expression of CD69 on immature and mature CD4+ SP thymocytes from WT and G184S bone marrow reconstituted WT mice. (C) Migration of spleen T cells and mature thymocytes to increasing concentrations of S1P in a transwell assay. The basal migration in the absence of S1P is subtracted from that in the presence of S1P. The WT and G184S thymocytes were distinguished on the basis of CD45.1/2 immunostaining. (D) Time dependent change in intracellular calcium following exposure of mature CD4+ SP thymocytes to 100 (above) or 10 nM (below) concentration of S1P. (E) Intracellular flow cytometry to assess the levels of pERK and pAKT following exposure of mature CD4+ SP thymocytes to 1, 10, or 100 nM of S1P. The thymocytes were prepared from bone marrow reconstituted mice and stimulated for the indicated durations. (F) Intracellular flow cytometry to analyze pERM levels following a 5 minute exposure to 100 nM S1P. (G) Flow cytometry to analysis S1PR1 expression on mature CD4+ thymocytes from WT and G184S mice following a 30 minute exposure to increasing concentrations of S1P. A), n=1 vs. 1 mice, from analysis of 3 vs. 3 mice (B), n=2 vs 2 mice, performed 3 times (C), n=3 vs. 3 mice, performed 3 times (D), n=1 vs. 1 mice, performed 3 times (E), n=2 vs. 2 mice, performed twice (F), n=1 vs. 1 mice, representative flow pattern of three experiments (G) n=2 vs. 2 mice, performed 4 times. *p < 0.05, **p < 0.005 and ***p < 0.0005 (Student’s t-test).

