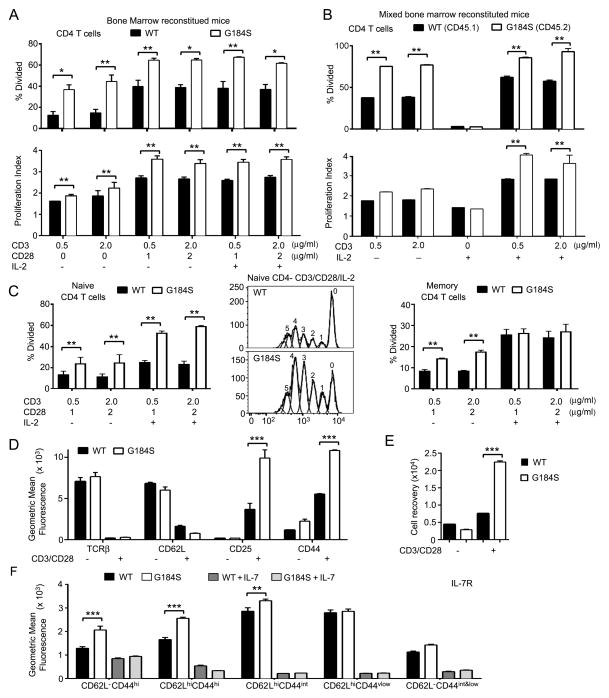
FIGURE 7.
Responses of G184S CD4+ T cells to TCR and IL-7 receptor engagement are intact. (A,B) CSFE dilution assays to determine the percentage of cells that divided and to calculate a proliferation index using CD4+ T cells purified from either wild type or G184S bone marrow reconstituted mice (part a) or from mixed bone marrow chimeric mice reconstituted with a 1:1 of WT and G184S bone marrow (part b). The cultures were stimulated various combinations of anti-CD3, anti-CD28, and IL-2 as indicated for 96 hours. (C) CSFE dilution assays to determine the percentage of cells that divided using splenocytes purified from either wild type or G184S bone marrow reconstituted mice and sorted for CD4+CD44lowCD62Lhi (naïve, left panel) or CD4+CD44hiCD62Llow (memory, right panel). The cells were stimulated as indicated for 96 hours and the % of divided cells determined. A representative dye dilution profile of the WT and G184S naïve CD4 T cells stimulated with anti-CD3, anti-CD28, and IL-2 is shown in the middle panel. (D) Flow cytometry results from the analysis of CD4+ T cells prepared from WT and G184S bone marrow reconstituted mice and stimulated with anti-CD3 and anti-CD28 for 96 hours for the expression of the indicated markers. (E) Recovery of CD3 and CD28 stimulated CD4+ T cells prepared from the spleens of WT or G184S bone marrow reconstituted mice at day 4 of culture. The initial cultures contained 5 × 10⁵ cells. (F) Flow cytometry to assess IL-7 receptor expression on WT and G184S CD4+ T cell subsets. WT and CD4+ T cells from WT and G184S mice were incubated with or without IL-7 (10 ng/ml) for 24 hours prior to measuring IL-7R expression on CD4+ T cell subsets delineated by expression of CD44 and CD62L. A), n=5 vs. 5 reconstituted mice (B), n=4 1:1 mix reconstituted mice (C), n=3 vs. 3 reconstituted mice. (D), n=4 vs. 4 reconstituted mice (E), n=4 vs. 4 reconstituted mice (E), n=5 vs. 5 reconstituted mice. All experiments were performed a minimum of 2 times. *p < 0.05, **p < 0.005 and ***p < 0.0005 (Student’s t-test).

