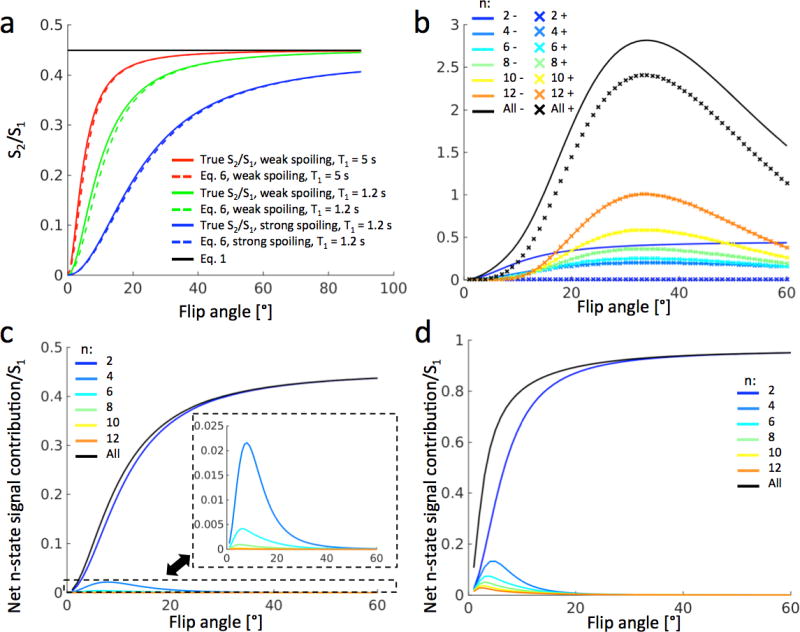
Figure 2.

(a) Comparison of proposed model of Eq. (6) (dashed) with complete simulations (colored solids) and with the simple exponential model of Eq. (1) (black solid) in a tissue with T2 = 40 ms. The blue (bottom) curves correspond to strong spoiling (gradient moment 156.6 mT/m•ms) and the green (middle) curves to weak spoiling (gradient moment 0.001 mT/m•ms), both with T1 = 1.2 s. The red (top) curves correspond to weak spoiling and T1 = 5 s. The green curves represent DESS scans that can be used for T2 estimation in cartilage. (b) Positive (dashed) and negative (solid) contributions to S2/S1 from pathways spending 2–12 TRs in the transverse plane. The black curves represent the sum of the different pathways. For pathways of order 6 and above, the positive (×) curves overlap with the negative (solid) curves. (c) Net contributions from the pathways in panel b shows that pathways with more than 2 TRs in the transverse plane contribute minimally. (d) The same simulations as in panel c, performed for synovial fluid at 3T (T1 = 3.6 s, T2 = 0.77 s), showing that the proposed model (blue signal) approximates the true signal (black curve) well for flip angles above 20°, even for long T1 and T2.
