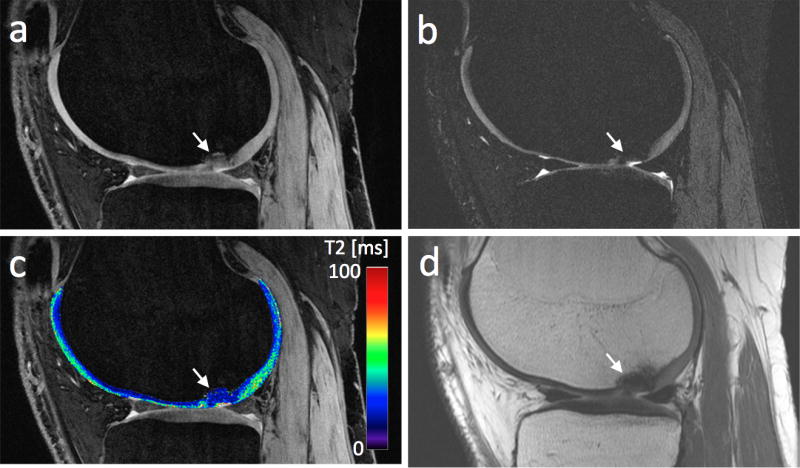
Figure 5.

(a) The first echo of a DESS scan of a patient with a chondral lesion (white arrow). (b) The second echo of the DESS scan. Panels a and b both show cartilage signal heterogeneity in the central femoral condyle (note the different windowing settings). (c) The T2 maps resulting from applying Eq. (7) to the data in panels a–b. (d) A PD weighted scan, acquired for reference, shows low signal in the lesion.
