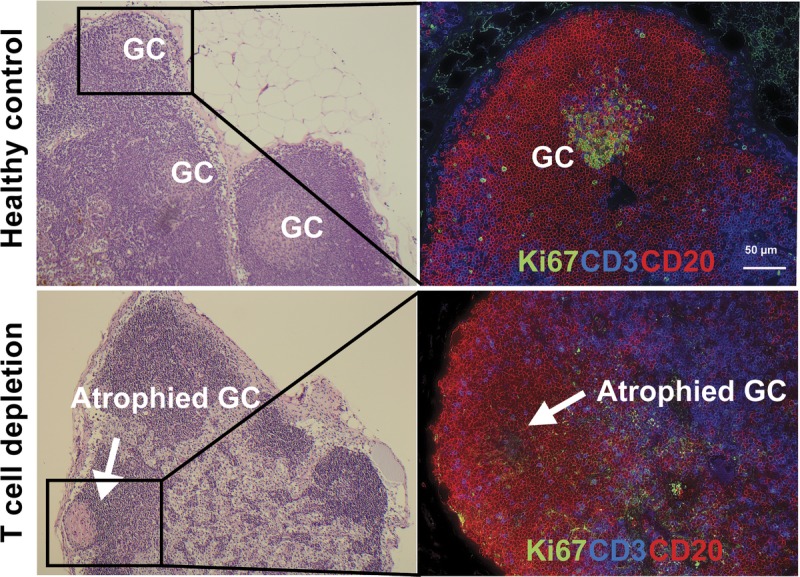
FIGURE 4.

Eradication of GC in the lymph node after T cell depletion. Representative haematoxylin & eosin (left) and immunofluorescence image (right) of GC staining with CD3 (blue), CD20 (Red), Ki67 (green) in lymph node of rhesus macaque. Upper panels show sections of LN from healthy control with GCs, and lower panels show atrophied GC (white arrow) after T cell depletion.
