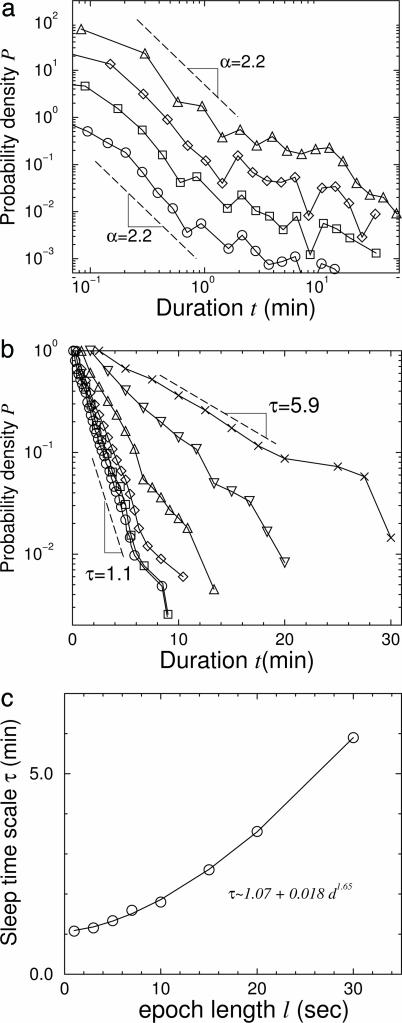
Fig. 3.
Dependence of the value of the characteristic time scale τ of sleep episodes and the power-law exponent α of wake episodes on the length of the scoring epoch. (a) Distributions of wake episode durations of mice obtained for different epoch lengths ℓ. Curves from top to bottom correspond to ℓ = 10 s (▵), ℓ = 5 s(⋄), ℓ = 3 s(□), and ℓ = 1 s(○) and are vertically offset for clarity. Dashed lines indicate power-law curves with an exponent α = 2.2. The power-law exponent α of the distribution of wake durations remains unchanged when the data are rescored by using different epoch lengths ℓ, thus confirming the validity of our results in Fig. 2a, where data from different species are scored by using different ℓ. (b) Distributions of sleep episode durations of mice obtained for different epoch lengths ℓ. Curves from top to bottom correspond to ℓ = 30 s(×), ℓ = 20 s(▿), ℓ = 10 s(▵), ℓ = 5 s(⋄), ℓ = 3 s (□), and ℓ = 1 s(○) and are vertically scaled so that they all start from P = 1. We find that the exponential characteristic time τ in the distribution of sleep episode durations increases with the epoch length ℓ.(c) Dependence of τ on ℓ for mouse data. We perform the same analysis for rats and cats and find the same functional form. We use this functional form to estimate the time scale of τ corresponding to the same epoch length ℓ for different species. The curves shown in Fig. 2b are rescaled in the x axis to match values of τ based on ℓ = 30 s.

