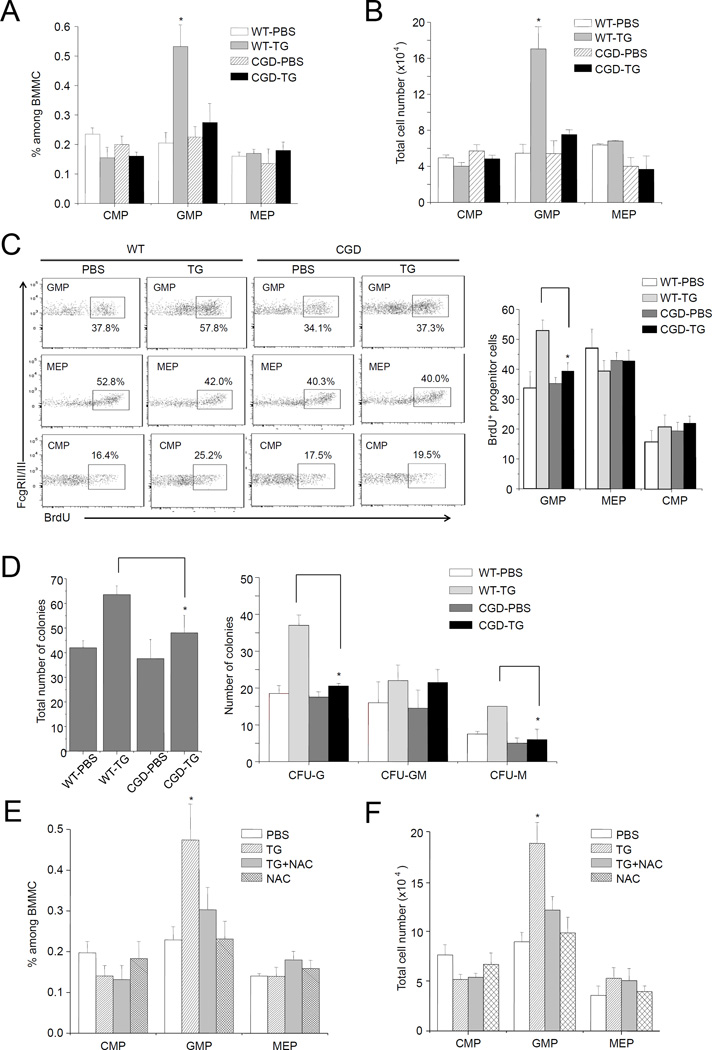
Figure 3. NADPH oxidase-mediated ROS production is essential for TG-induced reactive granulopoiesis.
(A) Inflammation-induced elevation of myeloid progenitor subset depends on phagocyte NADPH oxidase. Flow cytometry-based lineage analysis was conducted in WT and CGD mice 24 hr after TG injection. The percentage of each cell population among BMMCs was measured as described in Figure 1. (B) The absolute cell number of indicated cells per femur. Data represent the mean ± SD of n=4 mice per group. * p<0.01 versus PBS control. (C) Proliferation of progenitor cells in WT and CGD mice during inflammation was determined by BrdU incorporation. The WT data (also shown in Figure 1C) were included for comparison purpose. (D) The number of myeloid progenitors analyzed using an in vitro CFU-GM colony-forming assay. Data shown are mean ± SD of n=5 mice. * p<0.01 versus CGD. (E) Flow cytometry-based lineage analysis. Mice were treated with NAC (100 mg/kg, ip) 3 hr before TG injection. Twenty-four hr after TG injection, BM cells were isolated and analyzed. The percentage of each cell population among BMMCs was measured as described in Figure 1. (F) The absolute cell number of indicated cells per femur (n=5 for each group). * p<0.01 versus PBS control.

