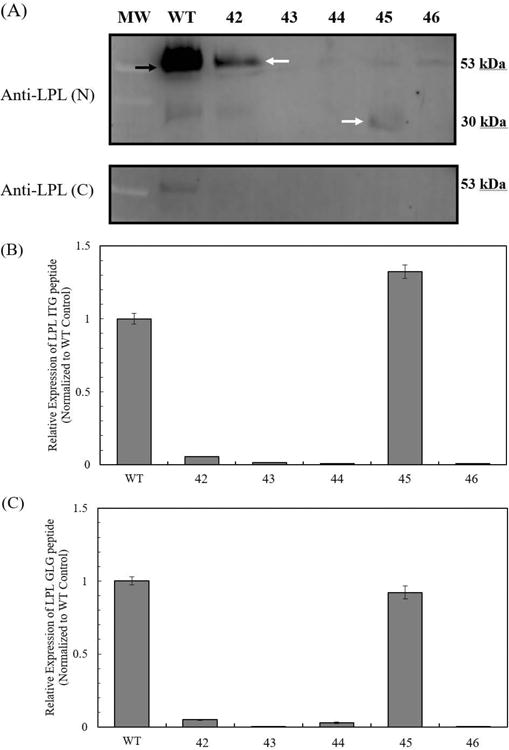
Figure 4.

Characterization of LPL protein expression from CHO lpl knockout cell lines by western analysis and MRM. (A) Expression of LPL protein probed by the N-terminus LPL antibody (Anti-LPL(N)) and C-terminus LPL antibody (Anti-LPL (C)). The predicted molecular weight of LPL is 53 kDa. The red arrow indicates the native LPL band. The yellow arrow indicates the altered LPL protein expressed by cell line 42, with predicted molecular weight of 52.2 kDa. The white arrow indicates the altered LPL protein expressed by cell line 45, with predicted molecular weight of 29.9 kDa. (B) Relative expression of LPL ITG peptide by MRM. (C) Relative expression of LPL GLG peptide by MRM. LPL expressions are normalized to the wildtype control. Error bars represent the standard error of the mean from three technical replicates.
