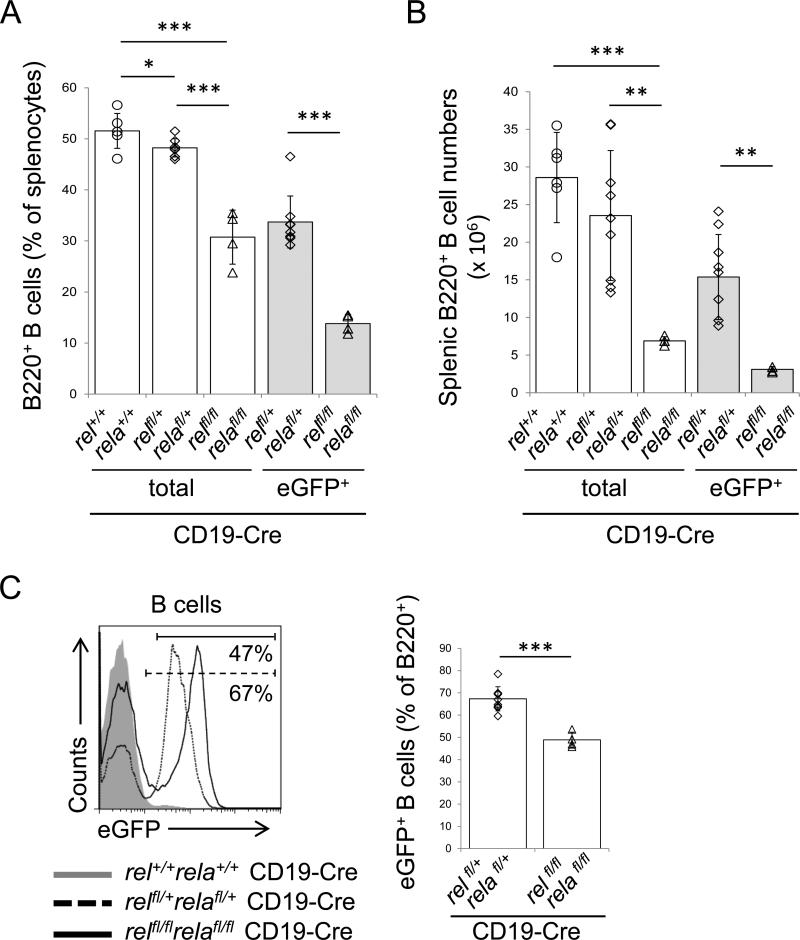
Figure 1. Combined c-REL and RELA deficiency leads to a severe reduction in splenic B-cells.
(A) Percentage and (B) number of splenic B-cells in relfl/flrelafl/flCD19-Cre and the corresponding heterozygous and CD19-Cre control mice as determined by flow cytometry. (C) Flow cytometry of eGFP expression in splenic B-cells of the indicated genotypes. The numbers below the gate indicate the percentage of eGFP+ B-cells among of B220+ B-cells of relfl/flrelafl/flCD19-Cre and relfl/+relafl/+CD19-Cre mice (left). Summary of the frequency of eGFP+ cells among the corresponding B-cell subsets (right). (A-C) Data are cumulative from independent experiments (n=4-9 per group), with each symbol representing a mouse. Data are shown as mean ± standard deviation. Statistical significance was determined by Student's t test (*, P<0.05; **, P<0.01; ***, P<0.001).

