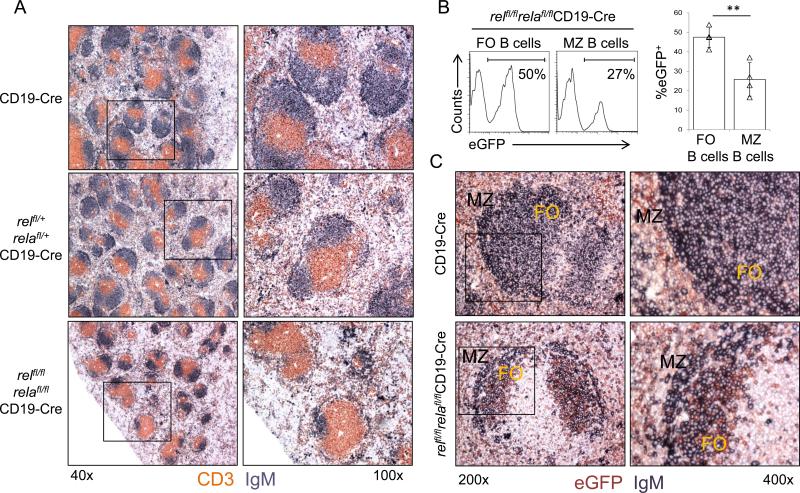
Figure 2. relfl/flrelafl/flCD19-Cre mice display fewer B-cell follicles within the splenic white pulp compared to controls and are characterized by counter selection against rel/rela-deleted MZ B-cells.
(A) Spleen sections from mice of the indicated genotypes were analyzed via IHC for the expression of CD3 and IgM. One representative mouse of three per group is shown. Original magnification ×40 (left) and ×100 (right). (B) The fractions of eGFP+ cells among splenic follicular (FO; CD23+CD21int) and marginal zone (MZ; CD21hiCD23−) B-cells in relfl/flrelafl/flCD19-Cre mice were determined by flow cytometry. Numbers below gates indicate the percentage of eGFP+ B-cells among the indicated B-cell subsets (left). Data are cumulative from independent experiments (n=4 per group), with each symbol representing a mouse, showing the frequency of eGFP+ cells among the corresponding B-cell subsets (right). Each symbol represents a mouse. Data are shown as mean ± standard deviation. Statistical significance was determined by Student's t test (**, P<0.01). (C) Spleen sections from mice of the indicated genotypes were analyzed by IHC for the expression of eGFP and IgM. FO, follicular area; MZ, marginal zone area. One representative mouse of three per group is shown. Original magnification ×200 (left) and ×400 (right).

