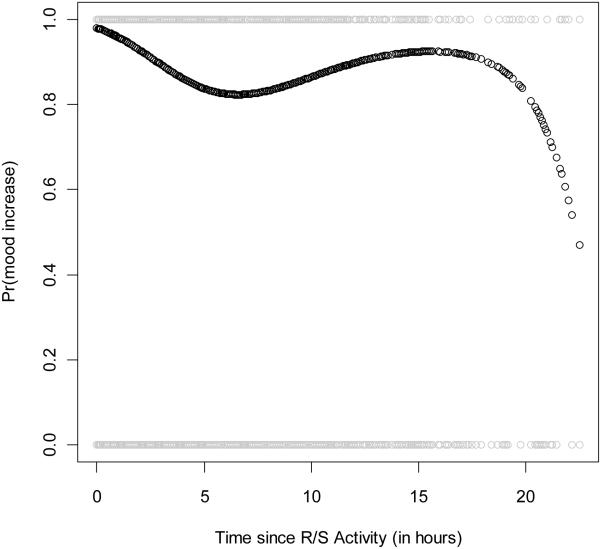
Figure 1. Probability of Improved Mood with Time Since Spiritual Activity*.
*Estimated probability of improved mood over time since initiating religious/spiritual activity (black curve with points). The mood at a given time is compared to the mood observed during the religious/spiritual activity. The x-axis represents the hours since the activity. Gray points that equal zero on the plot correspond to worse mood after the activity; gray points that equal 1 correspond to a level of mood that is the same or higher than the mood during the activity.

