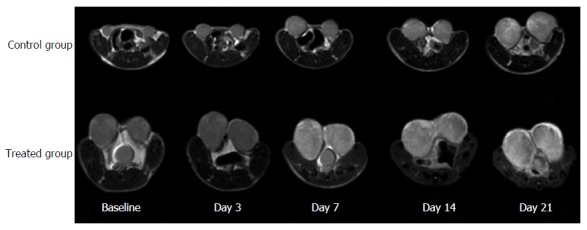
Figure 4.

Representative axial T2-weighted images of a control mouse (first row) and a treated mouse (second row) before (baseline) and after treatment (day 3, day 7, day 14 and day 21). Tumor volumes in the control mouse markedly increased on day 14 and day 21. In comparison, tumor volume in the treated mouse did not show an obvious change after treatment.
