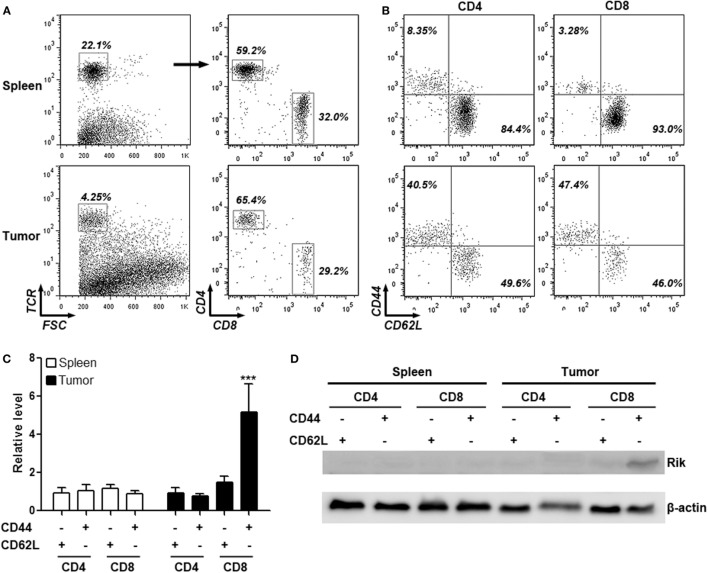
Figure 1.
Intratumoral CD8+CD44+CD62L− T cells express Rik. (A) Flow cytometry gating strategy of splenic and intratumoral CD4+ and CD8+ T cells. Total T cells were gated based on TCR staining and were subsequently discriminated by CD4 and CD8 staining. Numbers in the plots are proportions of gated cell populations. (B) Representative dot plots showing expression of CD44 and CD62L on splenic and intratumoral CD4+ and CD8+ T cells. Numbers in the plots are proportions of gated cell populations. (C) Rik mRNA level in splenic and intratumoral CD4+ and CD8+ T cells. N = 5 per group. (D) Rik protein expression in splenic and intratumoral CD4+ and CD8+ T cells. This is a representative image of two independent experiments. ***p < 0.001 compared with splenic CD4+CD44−CD62L+ cells.

