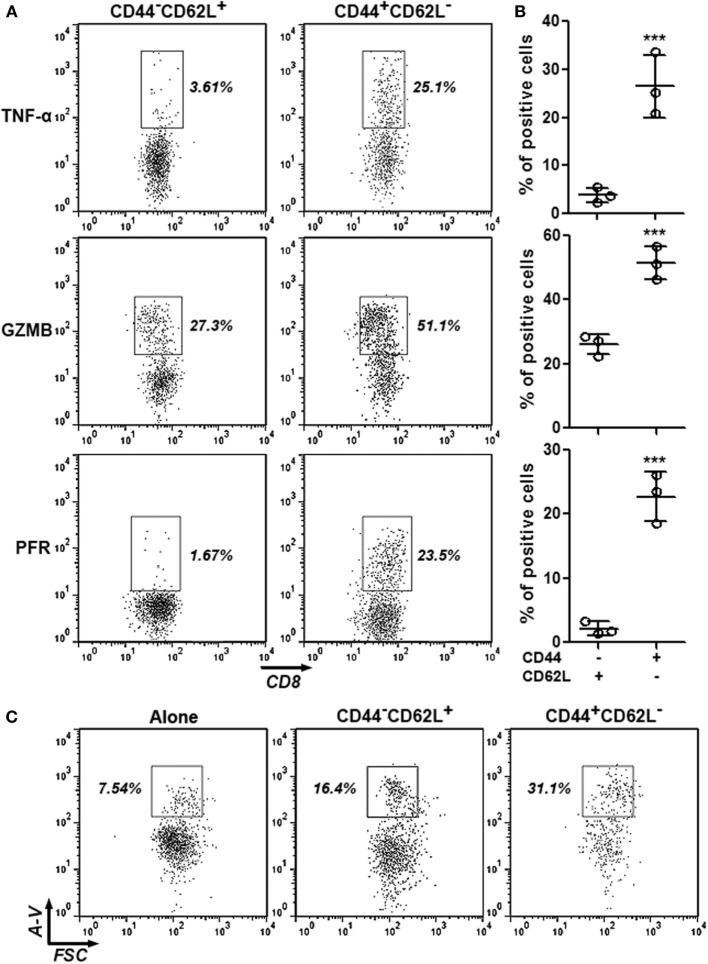
Figure 2.
Cytotoxic activity of intratumoral CD8+CD44+CD62L− and CD8+CD44−CD62L+ T cells. (A,B) Expression of TNF-α, granzyme B, and perforin in intratumoral CD8+ T cell subpopulations was analyzed by intracellular staining. Representative dot plots were shown in panel (A), and statistical analysis was demonstrated in panel (B). N = 3 per group. (C) Hepa-1c1c7 cell apoptosis after 24-h coculture with intratumoral CD8+ T cell subpopulations. The whole cells were stained with APC anti-CD45 antibody and FITC Annexin V. Only CD45-negative tumor cells were shown in the dot plots. This is a representative image of three independent experiments. Numbers in the plots are proportions of gated cell populations. Alone: tumor cells cultured alone. CD44−CD62L+: tumor cells cocultured with CD8+CD44−CD62L+ T cells. CD44+CD62L−: tumor cells cocultured with CD8+CD44+CD62L− T cells. A-V, Annexin V (***p < 0.001).

