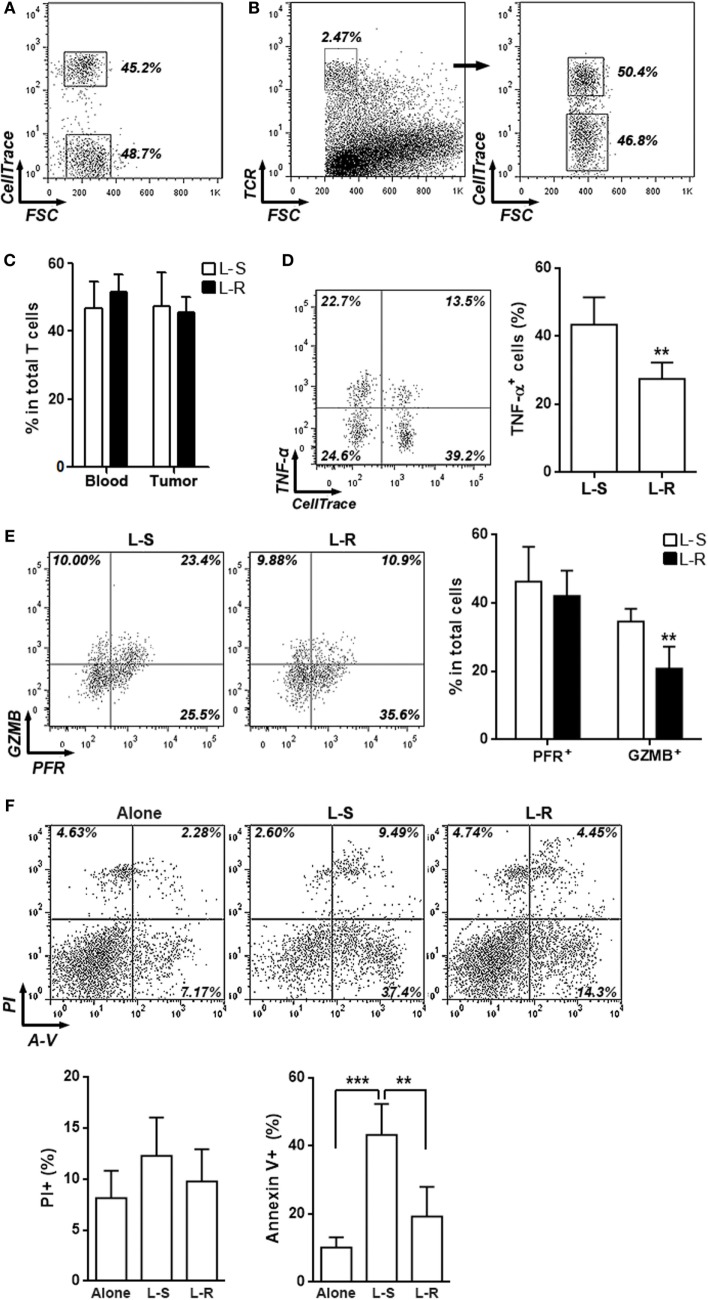
Figure 4.
Rik inhibits cytotoxic activity of activated CD8+ T cells in vivo. (A) CD8+ T cell mixture before adoptive transfer. CD8+ T cells transduced with Rik-expressing lentiviruses were labeled with CellTrace Far Red and were then mixed with equivalent number of unlabeled CD8+ T cells transduced with lentiviruses containing scramble sequence. Proportion of each CD8+ T cell subpopulation was shown in the dot plot. (B,C) Proportions of labeled and unlabeled CD8+ T cells in tumor implants. Intratumoral T cells were distinguished by TCR staining and CellTrace Far Red signal. Representative dot plots were shown in panel (B), and statistical analysis was shown in panel (C). L-S: CD8+ T cells transduced with lentiviruses containing scramble sequence. L-R: CD8+ T cells transduced with lentiviruses containing Rik sequence. Numbers in the plots are proportions of gated cell populations. N = 3 per group. (D,E) Expression of TNF-α (D), granzyme B and perforin (E) in transferred CD8+ T cells isolated from tumor implants. Note that these cells were not stimulated in vitro with phorbol ester. Left panels: representative dot plots. Right panels: statistics. Numbers in the plots are proportions of gated cell populations. N = 6 per group. (F) Hepa-1c1c7 cell apoptosis after 24-h coculture with transferred CD8+ T cells isolated from tumor implants. Alone: tumor cells cultured alone. L-S: tumor cells cocultured with control CD8+ T cells. L-R: tumor cells cocultured with Rik-overexpressing CD8+ T cells. Upper panel: representative dot plots. Lower panel: statistics of PI+ or Annexin V+ tumor cells. N = 4 per group (**p < 0.01; ***p < 0.001).

