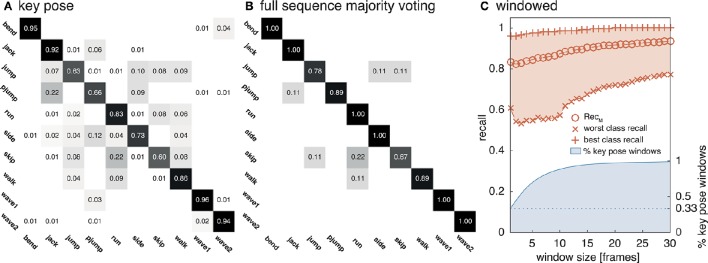
Figure 7.
Weizmann classification performance. The network was evaluated on the Weizmann dataset to allow a comparison to other approaches. As in Figure 6, (A) shows the classifications rates for a classification of single key pose frames per class. (B) Displays classwise recognition results for a full sequence evaluation using majority voting. Similar visual appearances might explain the increased rate of confusions for some of the classes (e.g., run and skip). In (C) the average best and worst per class recall values and ReclM are reported for temporal window sizes between 1 and 30 frames together with the relative number of windows which contain at least one frame classified as key pose.

