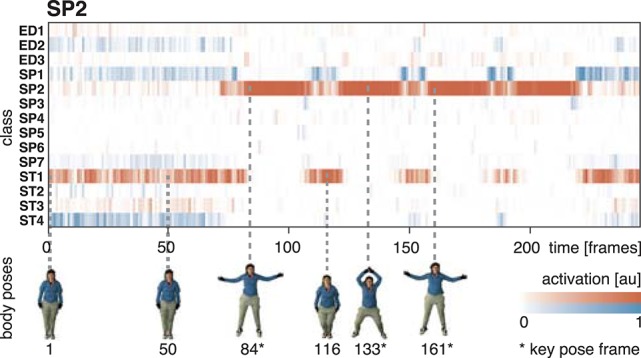
Figure 8.

Activation of cell populations. The activations of the cell populations in the last convolutional layer of the DCNN assigned to the 14 classes of the uulmMAD dataset are displayed for a network trained only on key pose frames and tested on all frames of the action SP2 (jumping jack). The activation level of the cell population with the maximum activation (red) and the remaining populations (blue) is encoded by color intensity. Corresponding poses are displayed for selected frames (bottom row). Key pose frames are marked by asterisks. The activation pattern shows how the cell population assigned to the class SP2 selectively responds to frames in the temporal neighborhood of the corresponding key pose frames. At the beginning and the end of the sequence, as well as in between the occurrence of key pose frames, different cell populations achieve the maximum average activation and thus result in misclassifications. Written informed consent for the publication of exemplary images was obtained from the shown subject.
