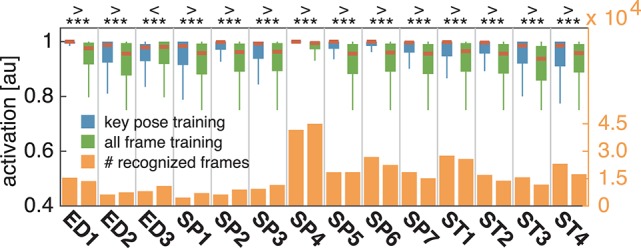
Figure 9.

Comparison of activation levels. The activation levels of the cell populations which resulted in correct classifications are displayed per class for key pose based (blue) and all frame (green) training alongside with the total number of correct classifications under both conditions (yellow). In case of key pose based training, activation levels are significantly increased, reflecting a higher confidence of the classification decision. Increased confidences are useful in situations where thresholding is applied on the activation level, e.g., to reduce the number of false negatives.
