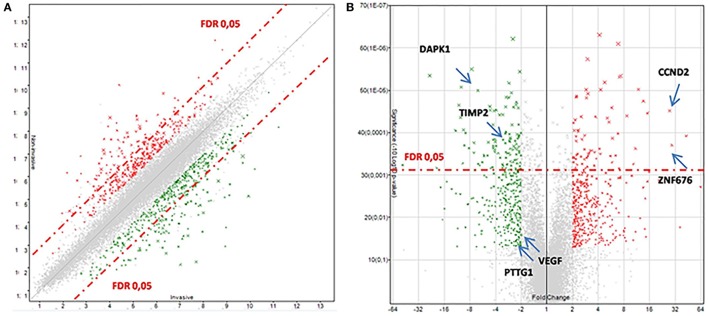
Figure 1.
Transcriptomic data between invasive and non-invasive corticotrophinomas. (A) Scatter plot. (B) Volcano plot. The over- and underexpressed genes are represented in red and green, respectively. In these plots, genes with a fold change less than 2 and ANOVA p-value >0.05 are shown in light gray (in the center). The dashed red-line shows where false discovery rate (FDR) = 0.05, with points above the line having p < 0.05. Arrows highlights some genes discussed in the text.

