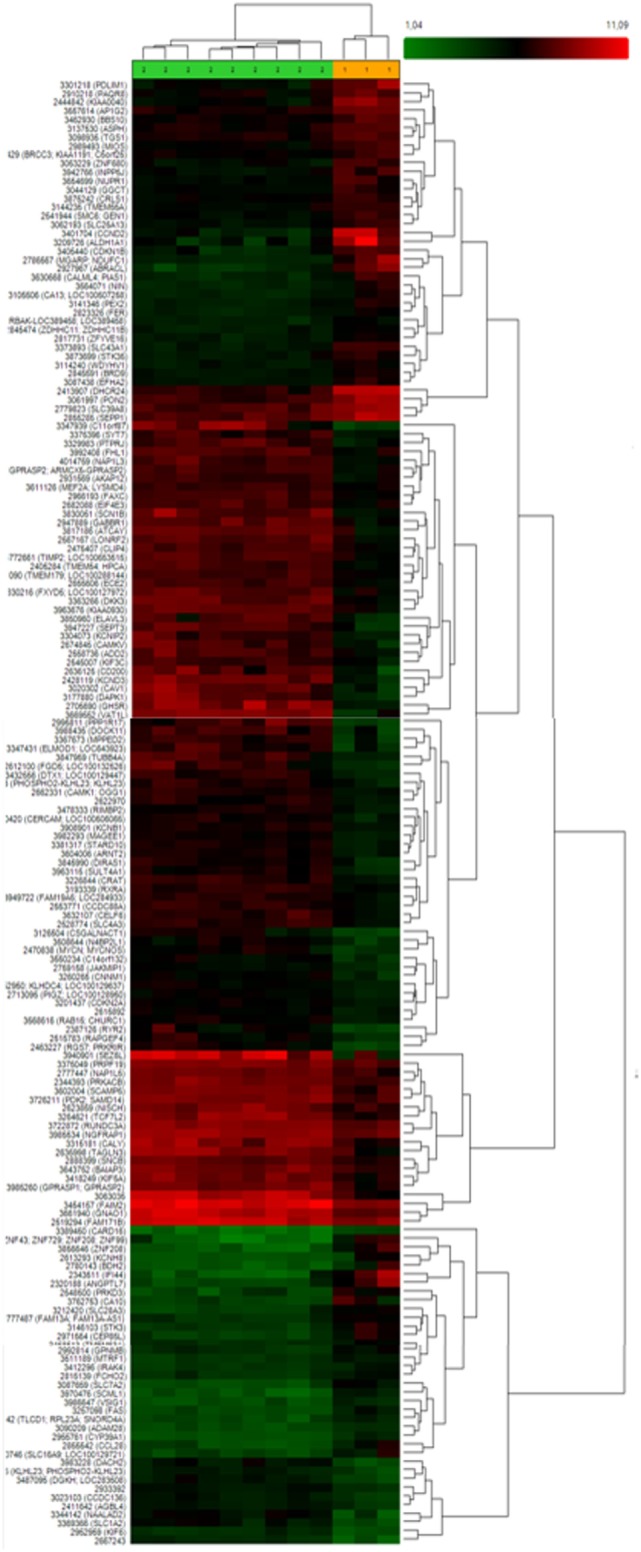
Figure 2.

Heat map and hierarchical clustering of 168 differently expressed genes between invasive and non-invasive corticotrophinomas showing that these groups exhibit a distinct gene expression profile. Different genes are represented in different rows and different experiments in different columns. The colored bar above the heat map (horizontal dimension) indicates the grouping variable—green for non-invasive (n = 9) and orange for invasive tumors (n = 3). The normalized expression value of each gene is color coded, from red for higher expressions to green for lower expressions and genes with no change in expression are represented in black.
