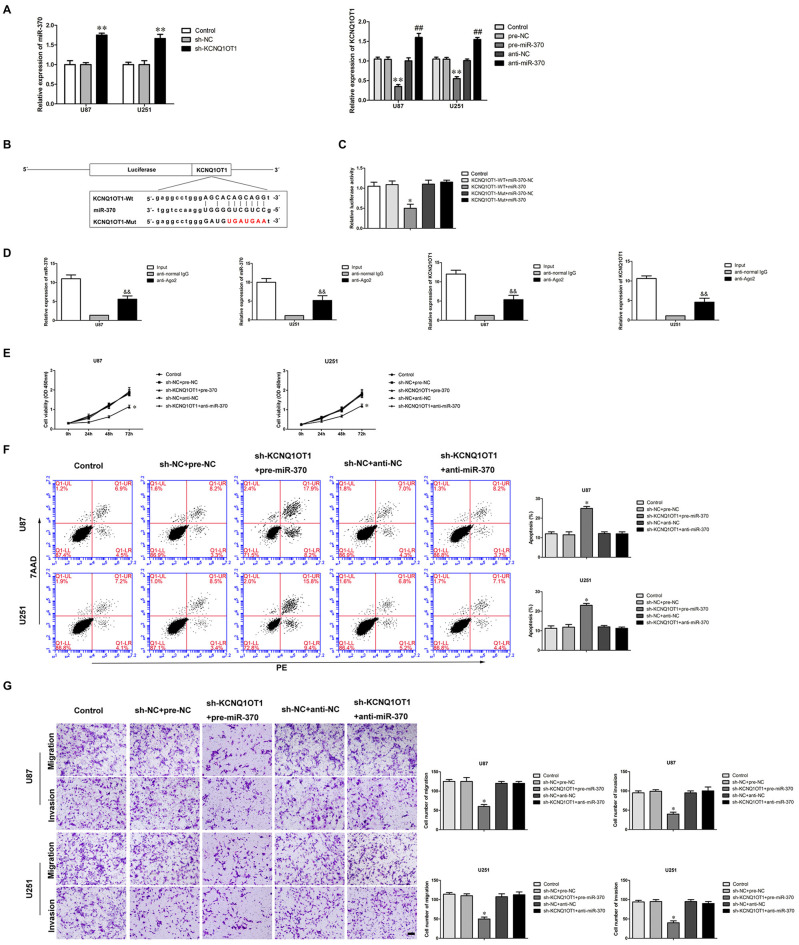
Figure 3.
MiR-370 targeted KCNQ1OT1 and its expression was negatively correlative with KCNQ1OT1, miR-370 was involved in KCNQ1OT1-mediated regulation of human glioma cells. (A) Quantitative Real-Time polymerase chain reaction (qRT-PCR) analysis for miR-370 expression negatively correlative with KCNQ1OT1 in human glioma cell lines. Data are presented as the mean ± SD (n = 5, each group). **P < 0.01 vs. sh-NC group. **P < 0.01 vs. pre-NC; ##P < 0.01 vs. sh-NC group. (B) KCNQ1OT1 harbored a putative miR-370 binding site, and designed mutant sequences were indicated. (C) Dual-luciferase reporter assay of human embryonic kidney (HEK) 293T cells co-transfected with KCNQ1OT1-WT and miR-370-NC or KCNQ1OT1-WT and miR-370, and KCNQ1OT1-Mut and miR-370-NC or KCNQ1OT1-Mut and miR-370. Data are presented as the mean ± SD (n = 5, each group). *P < 0.05 vs. KCNQ1OT1-WT + miR-370-NC group. (D) MiR-370 was identified in KCNQ1OT1-RISC complex. KCNQ1OT1 and miR-370 expression levels were measured using qRT-PCR (Data represent mean ± SD (n = 5, each group). &&P < 0.01 vs. anti-normal IgG group. (E) CCK-8 assay was used to evaluate the effect of KCNQ1OT1 and miR-370 on cell proliferation in human glioma cells at 24 h, 48 h and 72 h. Data are presented as the mean ± SD (n = 5, each group). *P < 0.05 vs. sh-NC + pre-NC group. (F) Flow cytometry analysis was used to evaluate the effect of KCNQ1OT1 and miR-370 on cell apoptosis in human glioma cells. Data are presented as the mean ± SD (n = 5, each group). *P < 0.05 vs. sh-NC + pre-NC group. (G) Quantification of cells to evaluate the effect of KCNQ1OT1 and miR-370 on cell migration and invasion in human glioma cells. Data are presented as the mean ± SD (n = 5, each group). *P < 0.05 vs. sh-NC + pre-NC group. Scale bars represent 20 μm.

