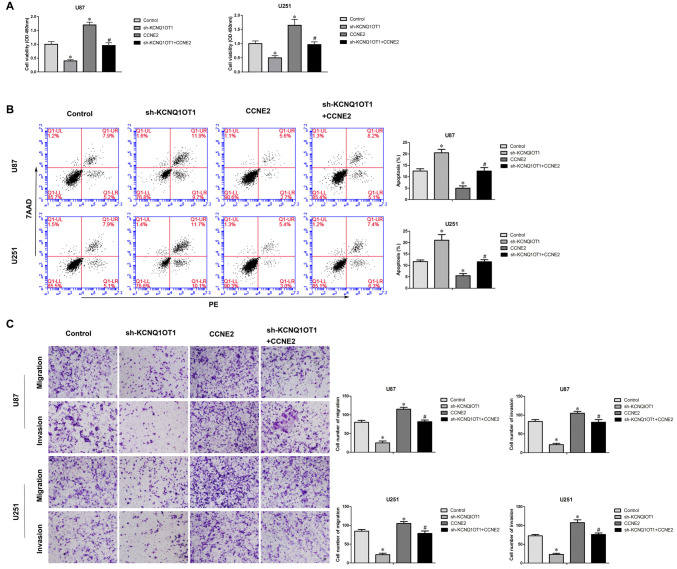
Figure 6.
Sh-KCNQ1OT1 phenotype was reversed by over expression of CCNE2. (A) CCK-8 assay was used to determine the proliferation effect of sh-KCNQ1OT1 + CCNE2 on human glioma cells. *P < 0.05 vs. Control group; #P < 0.05 vs. sh-KCNQ1OT1 group. (B) Flow cytometry analysis of human glioma cells with the expression of CCNE2 changed. *P < 0.05 vs. Control group; #P < 0.05 vs. sh-KCNQ1OT1 group. (C) Quantification of migration and invasion cells with the expression of CCNE2 changed. Representative images and accompanying statistical plots were presented. *P < 0.05 vs. Control group; #P < 0.05 vs. sh-KCNQ1OT1 group. Scale bars represent 20 μm.

