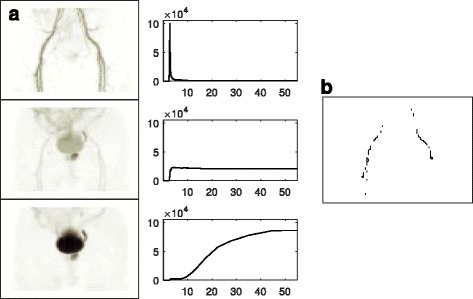
Fig. 1.

Maximum intensity projection factor images representing arterial, prostate, and bladder components, with corresponding time-activity curve signals (a). The voxels with the highest values in the vascular factor image corresponded to the iliac and femoral structures and defined the VOI for extracting the arterial input curve (b). The first and last ten slices were omitted from the factor analyses to avoid edge noise effects
