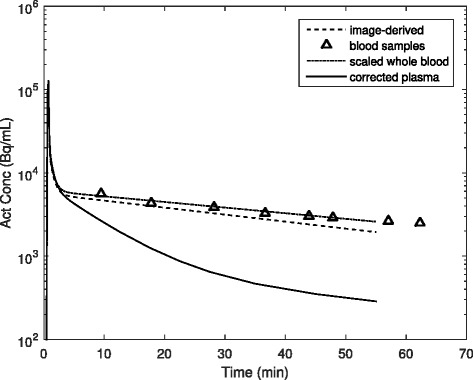
Fig. 2.

Example of arterial 18F-choline activity concentration curves. The image-derived blood activity (dashed line) was taken from the iliac and femoral vessels. The scaled whole-blood curve (dash-dot line) was found by correcting the image-derived curve for partial volume and tissue spillover while simultaneously scaling it to the manual venous blood samples (triangles). The plasma concentration (solid line) was calculated by applying the plasma partitioning coefficient and metabolite correction to the scaled whole-blood activity
