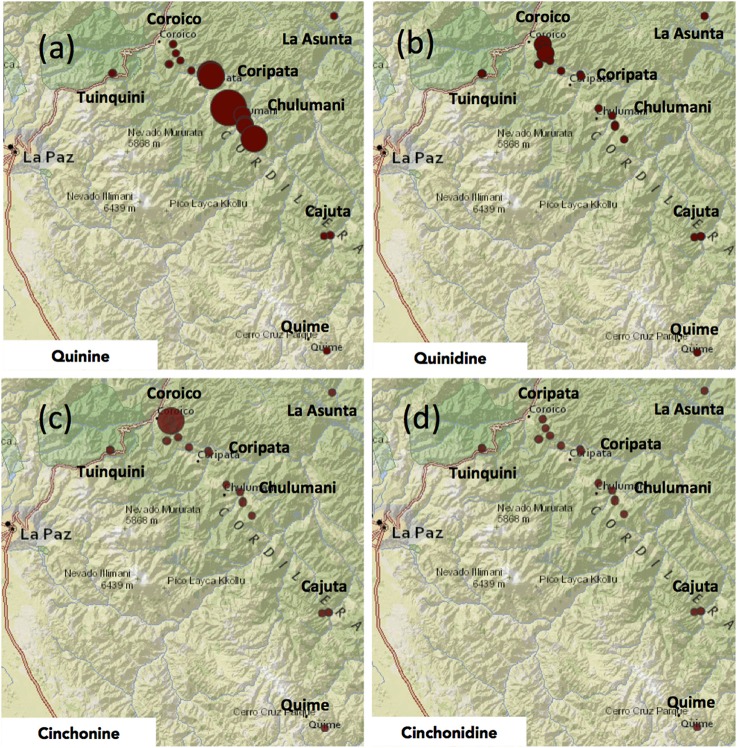
Figure 4.
Maps showing the relative concentration of each of the four major Cinchona alkaloids in each of the 22 samples of Cinchona calisaya across the distribution range of the included samples. (a) Quinine, (b) quinidine, (c) cinchonine, (d) cinchonidine. The size of the colored circles corresponds to the relative concentration of the alkaloid in each sample in each panel. The absolute concentration of the four major alkaloids is listed in Table 4.

