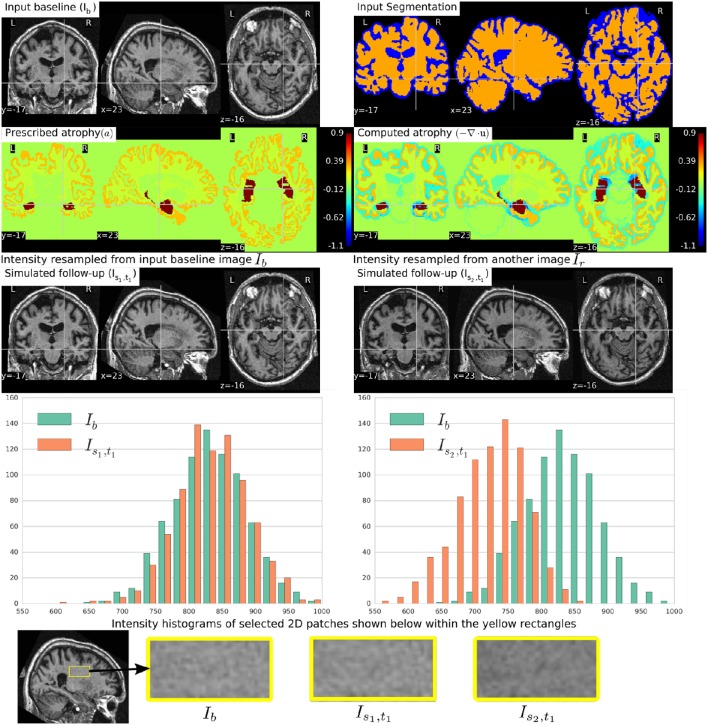
Figure 5.
Two simulated images are shown on the third row where the image on the left is resampled from the input baseline image Ib, and the image on the right is resampled from another image Ir of the same subject. Both Ib and Ir had already been corrected for the bias field intensity inhomogeneity. The intensity histograms shown are of a selected ROI (shown on the last row) where there is no significant morphological changes between the images. From the histograms we can see that the simulated image Is2, t1 has a different intensity characteristics than Ib, while the simulated image Is1, t1 has intensity characteristics that closely matches to that of Ib.

