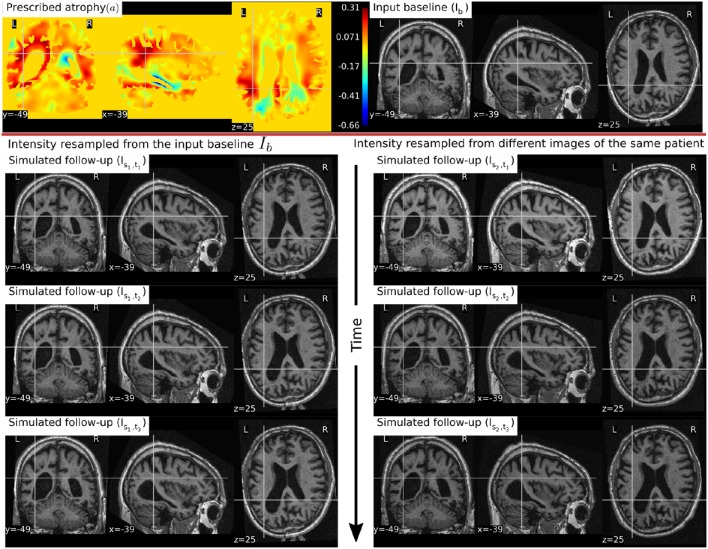
Figure 6.
Two sets of synthetic longitudinal images are shown which are simulated by prescribing a smoothly varying atrophy pattern. The first row shows the input prescribed atrophy and the input baseline image Ib of a subject, while the remaining rows show the two sequences. The sequence shown on the left have simulated images that are all resampled from Ib. On the right, each simulated image is resampled from real MRIs of the same subject but taken at different times (at 0.68, 1.77, and 3.3 years after the baseline scan respectively). As shown by the intensity histograms of Figure 7, the longitudinal synthetic images on the right have more realistic intensity variations than the one left.

