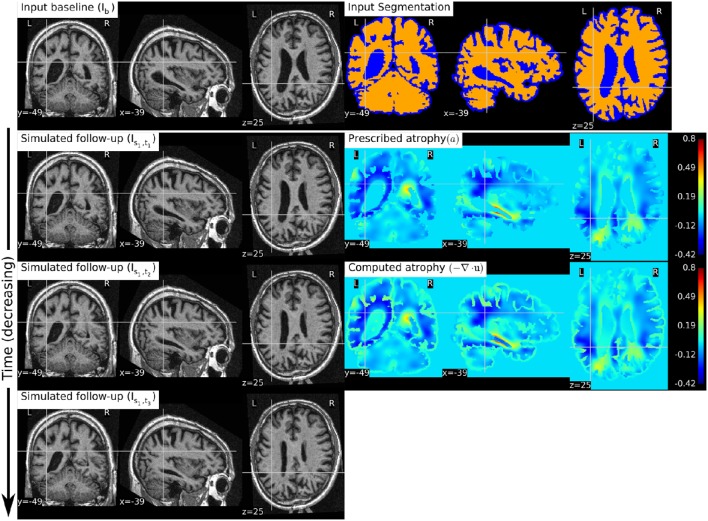
Figure 8.
The figure shows an example of simulating a longitudinal sequence with backward time-points. The input baseline image Ib is the same one as used in Figure 6, and the prescribed atrophy map is the negative of the map used in Figure 6. In the figure, we can see the shrinkage of the ventricles and the growth of the brain parenchyma.

