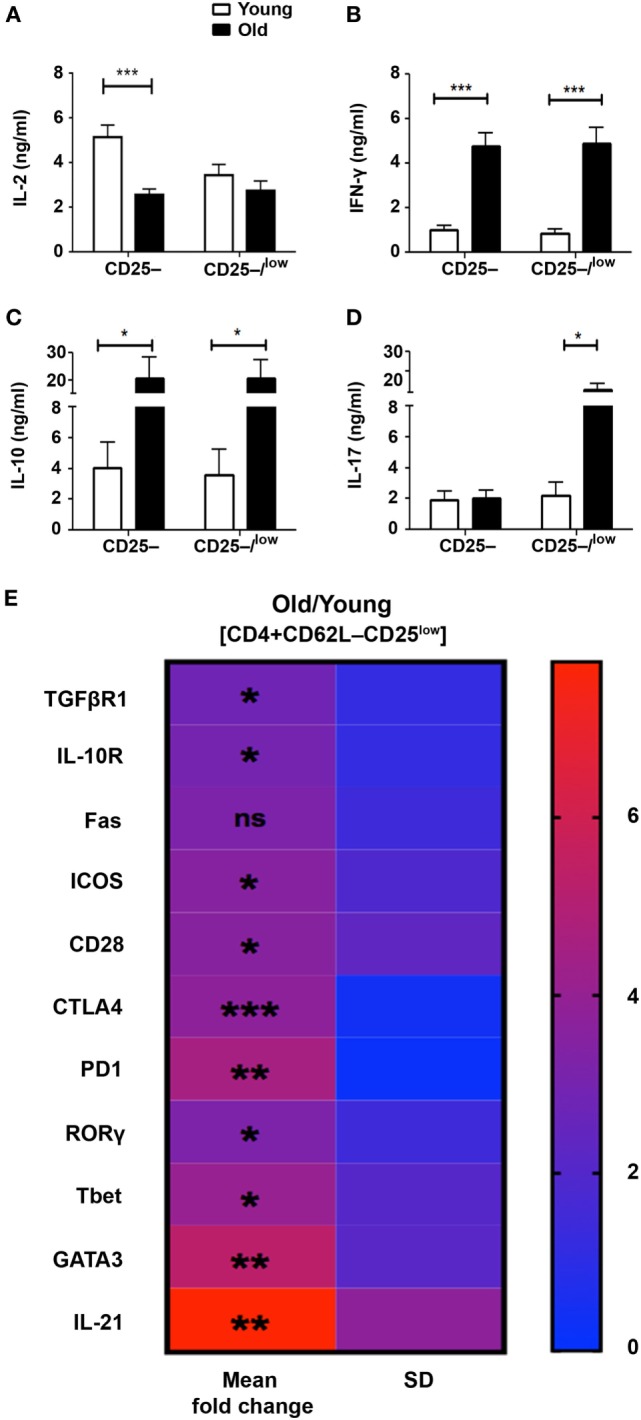
Figure 5.

The pattern of cytokine and gene expression is dysregulated in effector T cells (Teffs) from old mice. (A–D) Splenocytes were harvested from young and old mice, enriched for CD4+ T cells by magnetic separation, stained for CD4, CD62L, and CD25, and subsequently sorted into CD4+CD62L–CD25– and CD4+CD62L–CD25–/low Teff subsets as shown in Figure 3A. The sorted Teff subsets were stimulated for 48 h and then cytokine production was measured in the supernatant by ELISA. Data are shown as means ± SEM of four or nine independent experiments (each with 4–5 mice per group) with CD4+CD62L–CD25–/low or CD4+CD62L–CD25– Teff subsets, respectively. (E) CD4+CD62L–CD25low Teff subsets were sorted from young and old mice and total RNA was extracted. The RNA was reverse transcribed with a high-capacity cDNA reverse-transcription kit, and gene expression was analyzed with qPCR and is shown as fold change in old mice relative to young mice. Data are shown as means ± SD of 3–4 mice per group, representing three independent experiments (each with 3–4 mice per group). p values were calculated by Student’s t-test; *p < 0.05; **p < 0.01; ***p < 0.001. The calculated means, SDs, and p values are provided in Table S1 in Supplementary Material.
