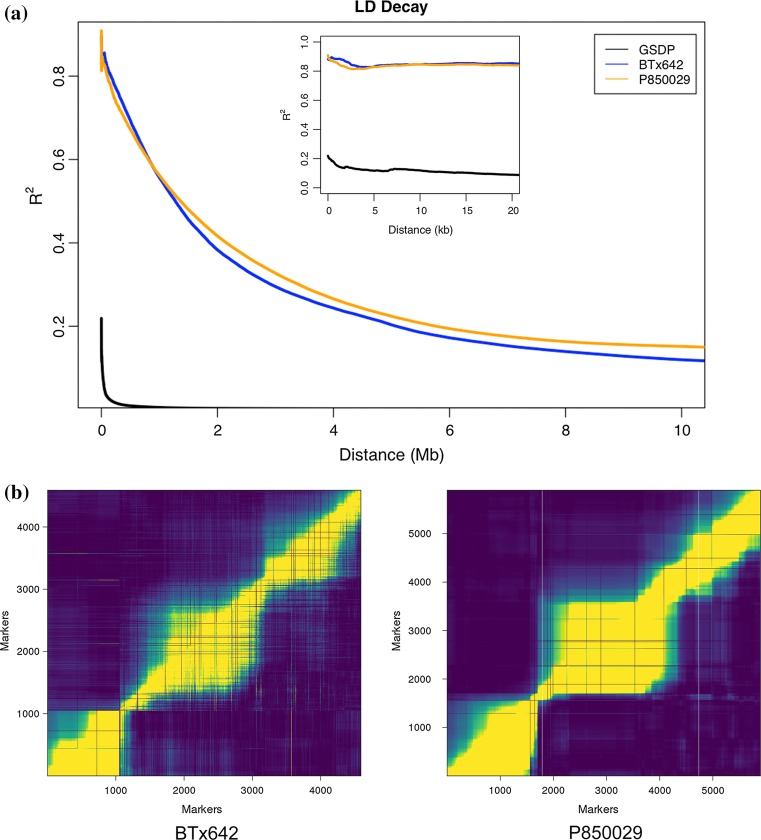
Fig. 2.
Linkage disequilibrium (LD) decay and recombination fractions of different sorghum populations. a Genome-wide average LD (r 2) in the grain sorghum diversity panel (GSDP), RIL population BTx642, and RIL population P850029. Average LD shown is from the mean of all ten sorghum chromosomes. b Pairwise recombination fractions in BTx642 and P850029 highlight regional blocks of LD on chromosome 1. The full SNP data set was used to increase marker density. Chromosome-wise recombination fractions for additional chromosomes are shown in Fig S1

