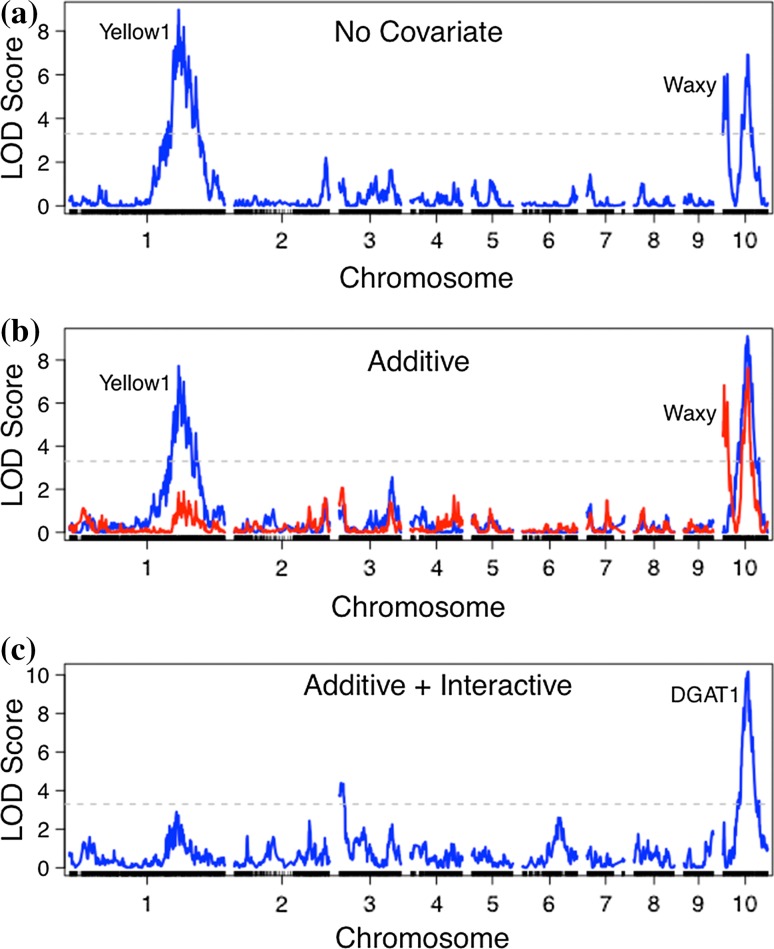
Fig. 4.
Confounding effects on crude fat QTL mapping in BTx642 were controlled by incorporating trait covariates. a QTL mapping results for crude fat with no covariates included. Markers along the x-axis are positioned based on genetic distance (cM) b Adding pericarp color (red) and amylose (blue) as additive covariates eliminated false-positive QTLs at the yellow1 and waxy loci, respectively. c Including amylose as an additive covariate and pericarp color as an interactive covariate eliminated false-positive QTLs and increased the peak LOD score found at 50 Mb on chromosome 10 near the homologue of maize diacylglyceroal O-acyltransferase 1 (DGAT1)

