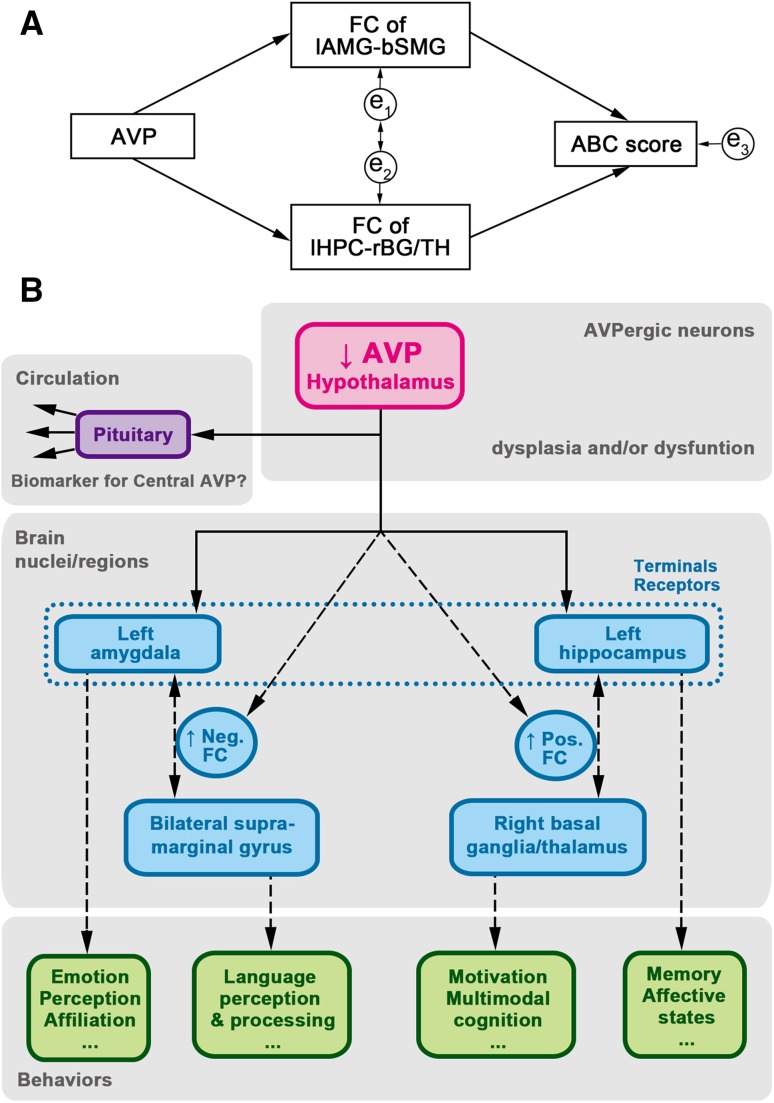
Fig. 7.
Diagram of hypothetical central AVP system pathway in children with ASD. (A) Hypothetical statistical model: χ2 = 0.233, P = 0.629, df = 1, RMSEA <0.001, GFI, 0.990; and AGFI, 0.905; e1-e3 indicate that errors could affect the model. (B) Diagram of hypothetical pathway. The blood AVP may serve as a biomarker of central AVP level. A descending AVP level impacts the function of the left amygdala and left hippocampus, which further extend their connectivity to other brain regions, resulting in various behavioral disorders. Solid lines with one-way arrows indicate secretion and projection. Broken lines with one-way arrows indicate a possible impact on function. Broken lines with two-way arrows indicate the possible functional connectivity between brain regions. AGFI, adjusted goodness-of-fit index; AVP, arginine-vasopressin; df, degrees of freedom; FC, functional connectivity; GFI, goodness-of-fit index; RMSEA, root mean square error of approximation.

