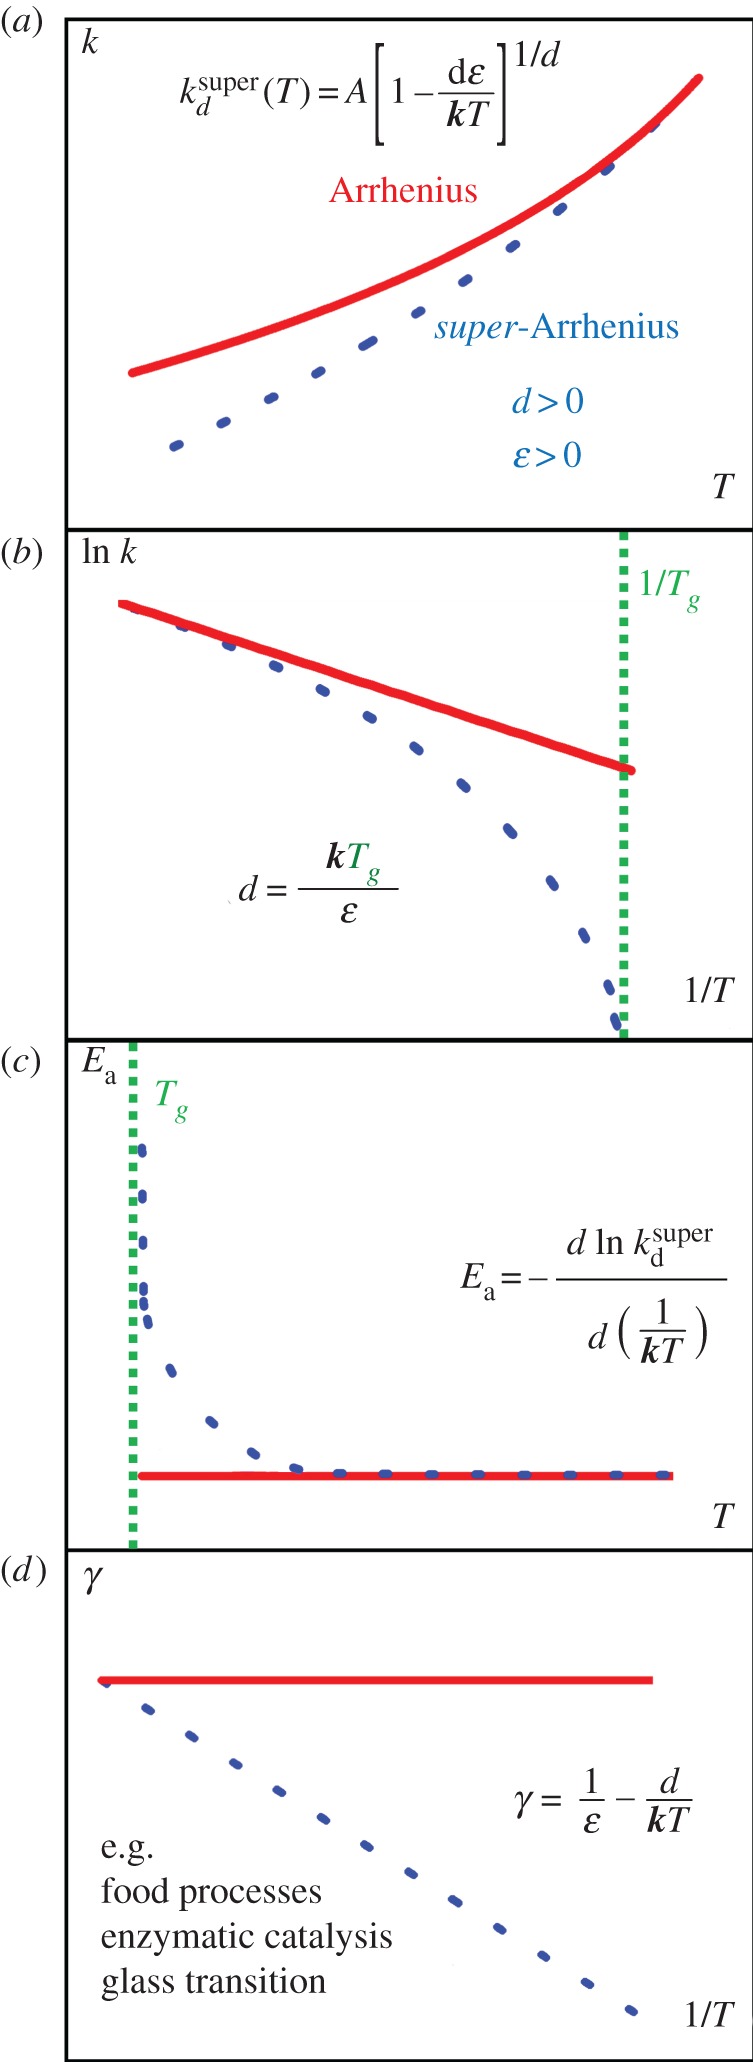
Figure 1.

(a) The exponential dependence of reaction rates k(T) upon absolute temperature T. Deviations from linearity at low temperatures can be observed in the plot as showing a ‘convex’ curvature, i.e. lower than expected rates as temperature decreases. In (b), the super-Arrhenius behaviour is accentuaded in an Arrhenius plot view, where ln k(T) is reported against 1/T. In supercooled systems, an approximate relationship between the deformation parameter d and the glass transition temperature Tg illustrates the trend of this complicated phenomenon (see §4a). (c) Deviations from constancy of the apparent activation energy, expected from the Arrhenius Law, manifests for a super-Arrhenius behaviour the apparent activation energy increase with decreasing temperature. Panel (d) exhibits the linear relationship of the transitivity (equation (2.4)) with inverse temperature, basic to our derivation of the d-Arrhenius formula. Super-Arrhenius behaviour, often arising for collective phenomena, is amenable to a classical mechanics interpretation for the examples mentioned and discussed in §4a. (Online version in colour.)
