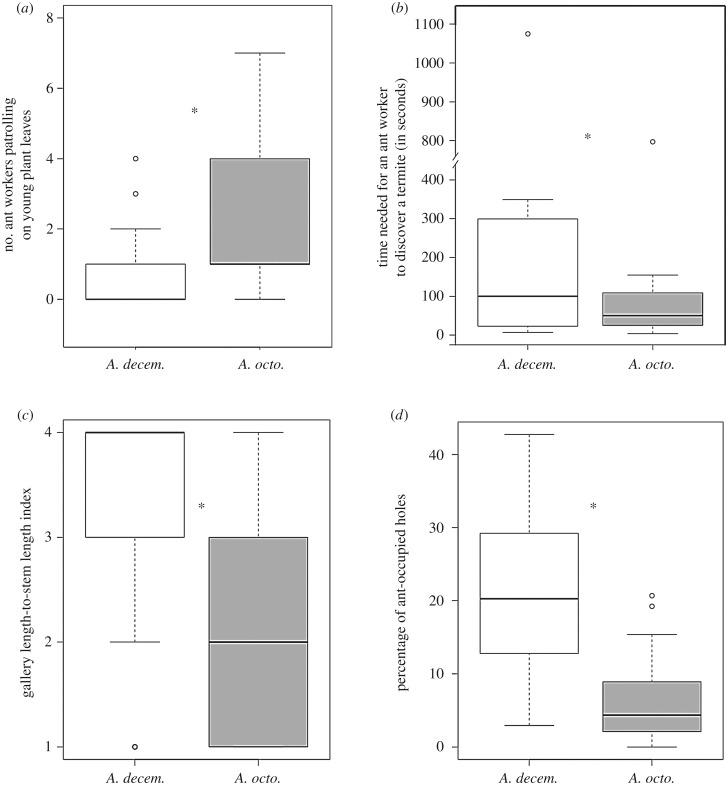
Figure 3.
(a) Ant patrolling activity on Hirtella physophora leaves expressed as the number of workers per leaf. (b) Ant efficiency in discovering alien arthropods on H. physophora leaves expressed as the time needed for workers to find a termite. (c) Ant investment in gallery construction expressed as a gallery length-to-stem length index. The index varies from 1 (<20% of the stems covered by galleries) to 4 (>80%). (d) Gallery use by ants expressed as the percentage of ant-occupied holes. Box and whisker plots represent, top to bottom, the 90th percentile, 75th percentile, median, 25th percentile and 10th percentile, and open circles indicate outliers. ‘n.s.’ or asterisks indicate the absence or presence of a significant difference between ant species, respectively.

