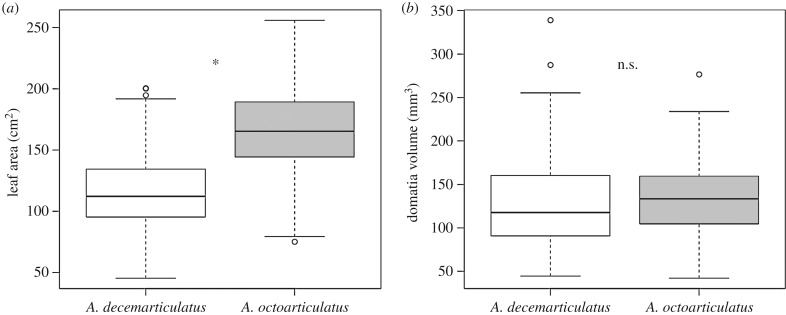
Figure 5.
(a) Leaf area (cm2) and (b) domatia volume (mm3) of Hirtella physophora leaves according to the associated ant species. Box and whisker plots represent, top to bottom, the 90th percentile, 75th percentile, median, 25th percentile and 10th percentile, and open circles indicate outliers. n.s. or asterisks indicate the absence or presence of a significant difference between ant species, respectively.

