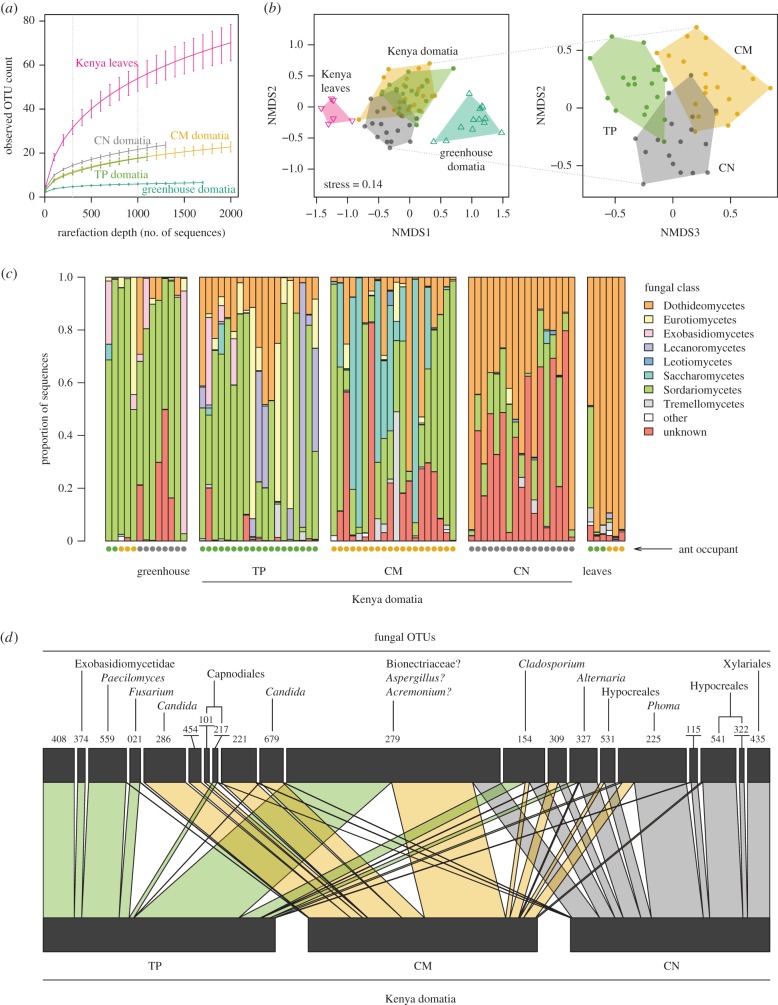
Figure 2.
(a) Kenyan domatium communities differ in taxonomic diversity compared with leaf sample communities and greenhouse domatium communities. Error bars show standard errors. (b) Non-metric multidimensional scaling (NMDS) based on Sørensen distances for rarefied dataset. Greenhouse domatia and leaf samples were distinct from Kenyan domatium samples. Kenyan domatium communities also differed among ant species. (c) Relative abundances of fungi aggregated to class differ between sample types and between ant occupants. Each column represents one sample. (d) Bipartite graph of ant species against most abundant fungal OTUs in rarefied dataset. Connections reflect sequence counts.

