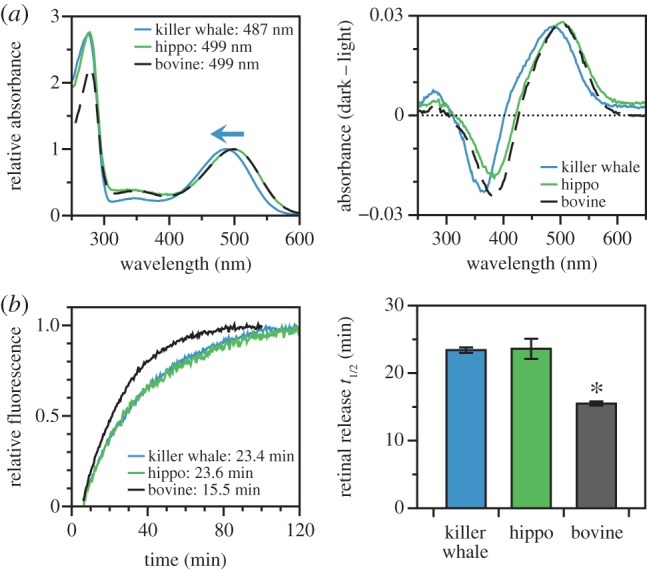
Figure 1.

Functional characteristics of wild-type killer whale and hippo rhodopsin, as compared with bovine rhodopsin. (a) Spectral absorbance curves of dark state rhodopsin (left) and dark–light difference spectra (right). Indicated spectral peaks (λmax) were estimated according to the curve-fitting methodology of Govardovskii et al. [23] showing standard vertebrate peaks for the bovine and hippo, but a blue-shifted peak for the killer whale. (b) Fluorescence assays of retinal release rates following light activation of rhodopsin, with indicated half-lives estimated by fitting time courses to first-order exponential curves (left) where the killer whale has a half-life similar to the hippo, but significantly greater than the bovine (right).
