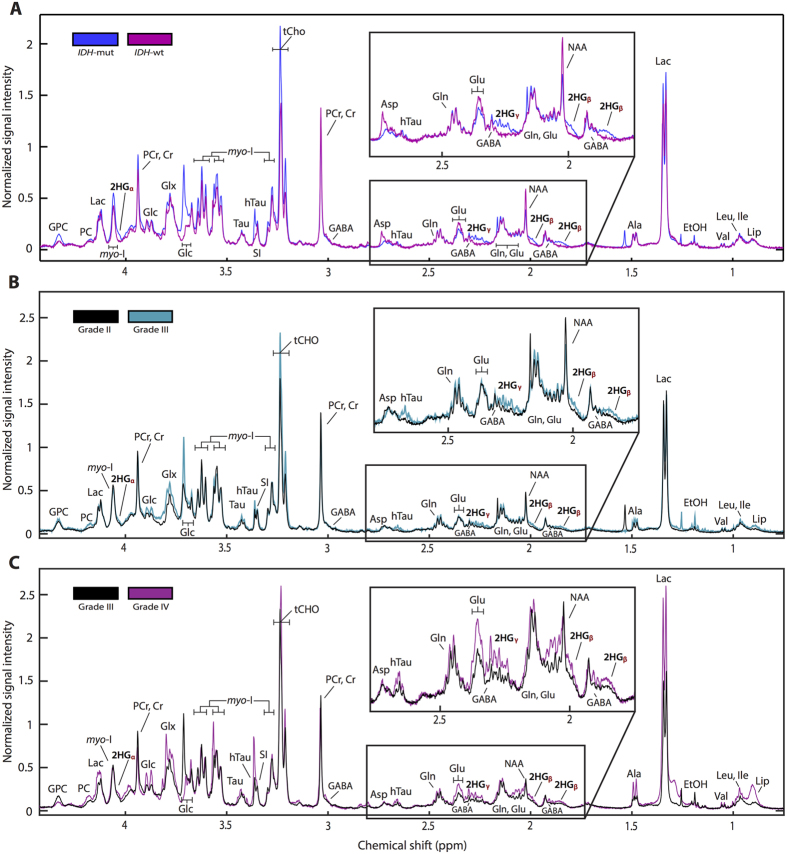
Figure 2. Averaged HR-MAS spectral profile from IDH mutation status and MP across different histological grades.
Results were normalized by tissue weight to produce an averaged spectrum at the tissue sample level for IDH genotypes and individual grades. IDH-mutated spectral profiles demonstrate increased 2HG, Cho, GPC, PC, and tCho and decreased Glu and GABA (A), while many metabolites were elevated in tumors that had undergone MP (B,C).

