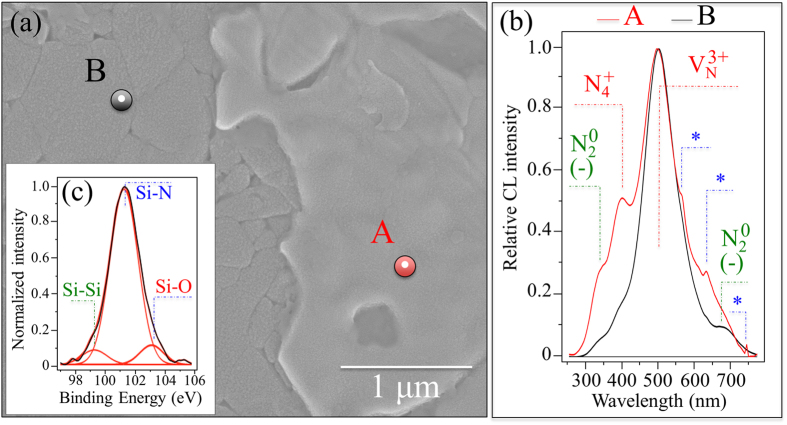
Figure 4.
(a) Backscattered SEM micrograph of the N2-annealed Si3N4 sample (the brighter area locates Si-Y-Al-O-N phases); in (b) a comparison between normalized CL spectra collected at locations A and B in (a); and, in (c), the XPS Si 2p photoelectron spectrum revealing the concurrent existence of Si-Si, Si-O, and Si-N bonds.

