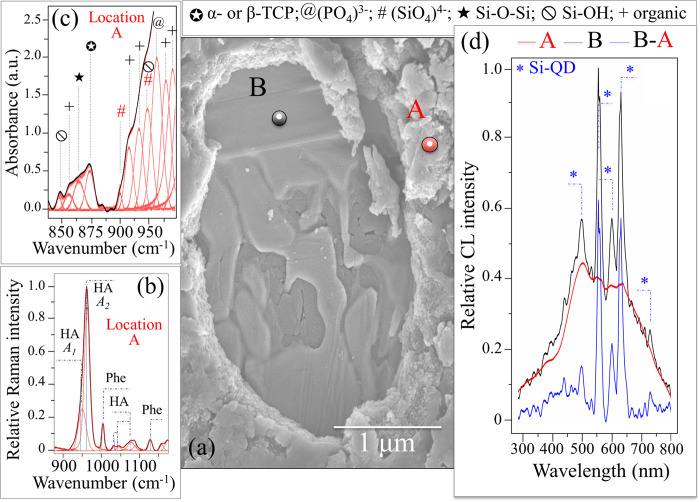
Figure 6. Electron micrograph showing the morphology of the N2-annealed Si3N4 sample after 7 days exposure to SaOS-2 cells.
The zone imaged in (a) shows a relatively thick layer of hydroxyapatite (cf. Raman spectrum in (b)) with a zone in which a layer was mechanically removed. In this zone, note the “icing” Si-Y-Al-O-N phases on which the SaOS-2 cells covered the hydroxyapatite layer. In (c), the FT-IR spectrum shows the fingerprint for (SiO4)4− substitution in bony apatite as described in the text. Subtracting the CL spectrum retrieved at location A (hydroxyapatite layer) from that at location B (Si-Y-Al-O-N) singles out the CL emission spectrum of Si-QDs (d).

