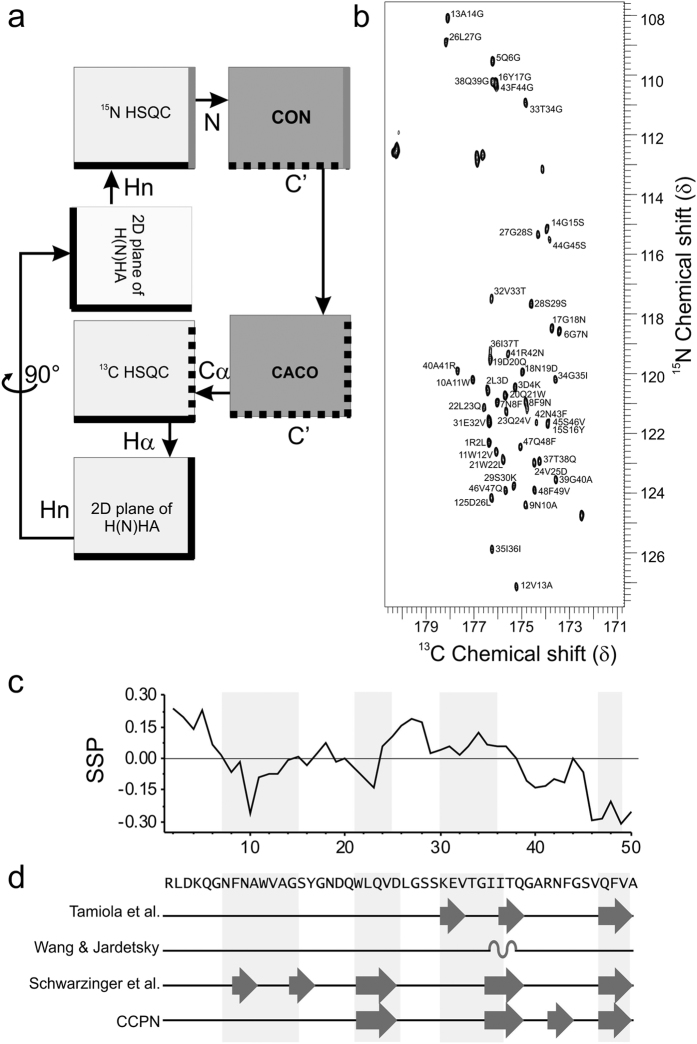
Figure 2. NMR data overview.
(a) Schematic representation of the NMR workflow incorporating the use of 13C-direct detection experiments. (b) CON spectrum of human medin collected at 288 K on a Bruker Avance III NMR spectrometer operating at 14.1T using a TXO probe. (c) SSP27 output using C’ and Cα shifts for medin. (d) Structural propensity of backbone ΔC’, ΔCα and ΔHα chemical shifts towards either α-helix or β-strand from random coil calculated using ncIDP with reference chemical shift libraries as shown (Tamiola et al.28, Wang and Jardetsky76, and Schwarzinger et al.77) and CCPN29. Structural propensities of 10% or more are shown and summarised in Table S2. Light grey regions indicate areas of secondary structure from computational modelling as shown in Fig. 1.

