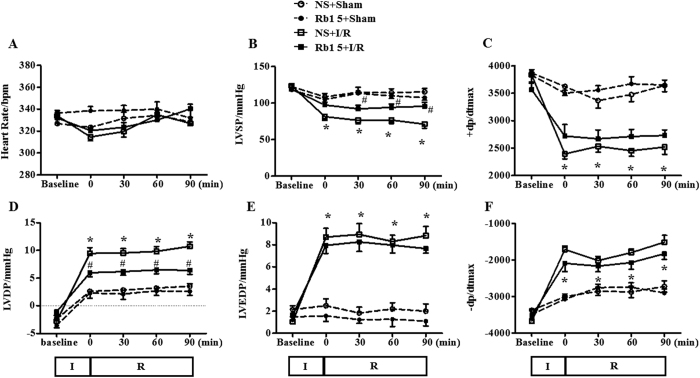
Figure 3. Effect of Rb1 treatment on rat heart function.
Presented are the time courses of HR (A), LVSP (B), +dp/dtmax (C), LVDP (D), LVEDP (E) and −dp/dtmax (F) in different groups. The linear mixed effect models were analyzed for repeated measurement data, and least squares means were calculated between the groups of different time points. Data are expressed as the means ± S.E.M (n = 6). *p < 0.05 vs. sham group, #p < 0.05 vs. I/R group.

