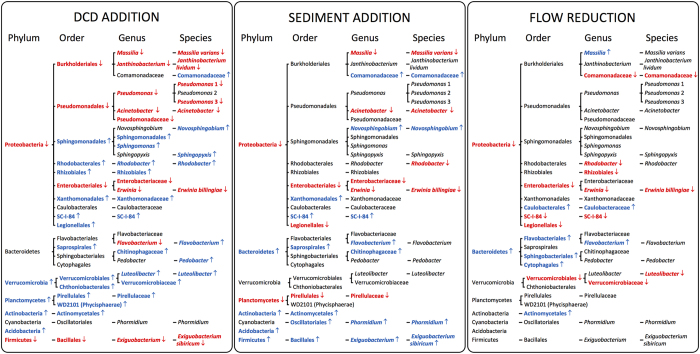
Figure 4. Directions of significant responses of the abundant (>1.0% of all sequences) phyla, orders, genera and species to DCD addition, sediment addition or flow velocity reduction.
Arrows and colours indicate positive (↑, blue) and negative responses (↓, red). For complete taxa names see Table S1.

