Figure 3.

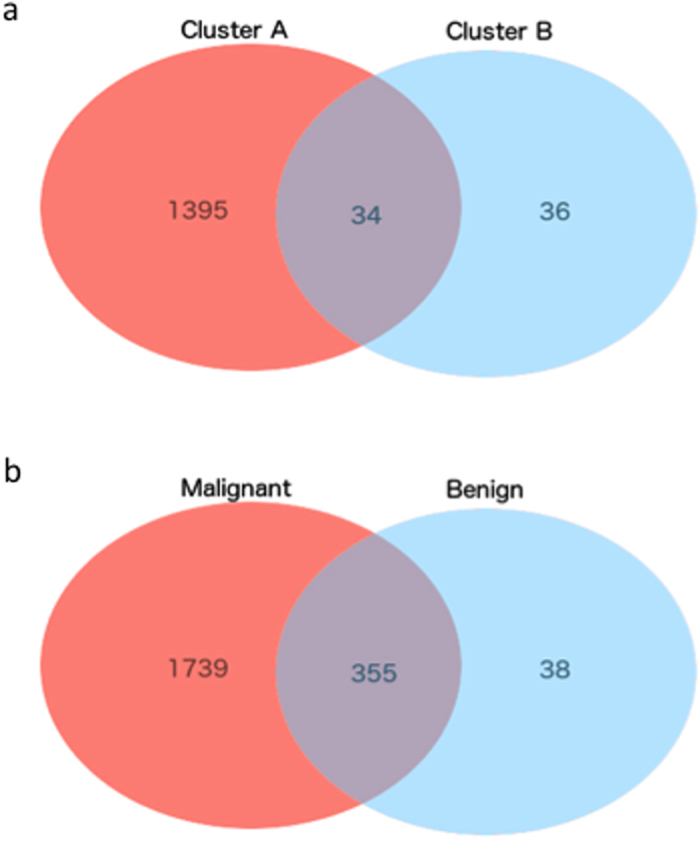
(a) Venn diagram of probes aberrantly methylated in the two clusters (compared to normal tissue). (b) Venn diagram of probes aberrantly methylated in benign and malignant tumours, compared to normal tissue.

(a) Venn diagram of probes aberrantly methylated in the two clusters (compared to normal tissue). (b) Venn diagram of probes aberrantly methylated in benign and malignant tumours, compared to normal tissue.