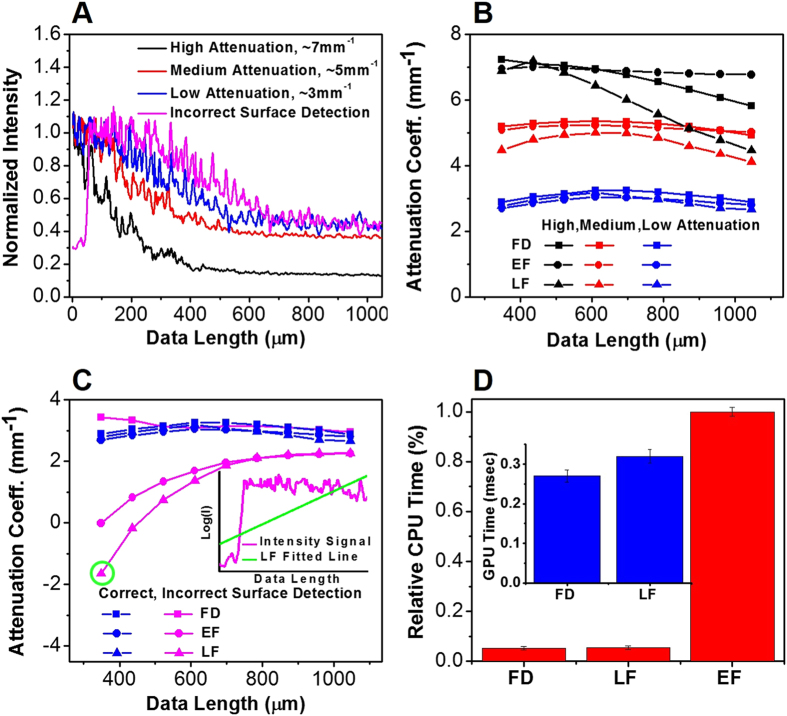
Figure 1.
(A) Representative normalized average OCT intensity signals I(z) with high (black line), medium (red line) and low (blue line) attenuation coefficients. Magenta line shows the same I(z) at low attenuation coefficient (blue line), but with incorrect tissue surface detection. These intensity signals were rescaled to a similar range for display purpose. (B) and (C) Using the same normalized average intensity signals as shown in (A), the attenuation coefficients were calculated using the Fourier domain (FD, rectangles), the linear fitting (EF, circles), and exponential fitting (LF, triangles) methods as the data length (in the z-direction) increases. The inset of (C) shows the logarithm of OCT intensity signal with incorrect surface detection and a data length of ∼350 μm (magenta line), and the wrongly fitted line using the LF method (green line) which resulted in a negative attenuation coefficient highlighted with the green circle. (D) Relative CPU time required to process a dataset with approximately 2048 A-lines/frame × 256 frames using the FD, LF, and EF methods. Inset shows the GPU time (implemented in CUDA C/C++) needed for the FD and LF methods to process one B-frame with 2048 A-lines/frame and 2,048 pixels/A-line.

