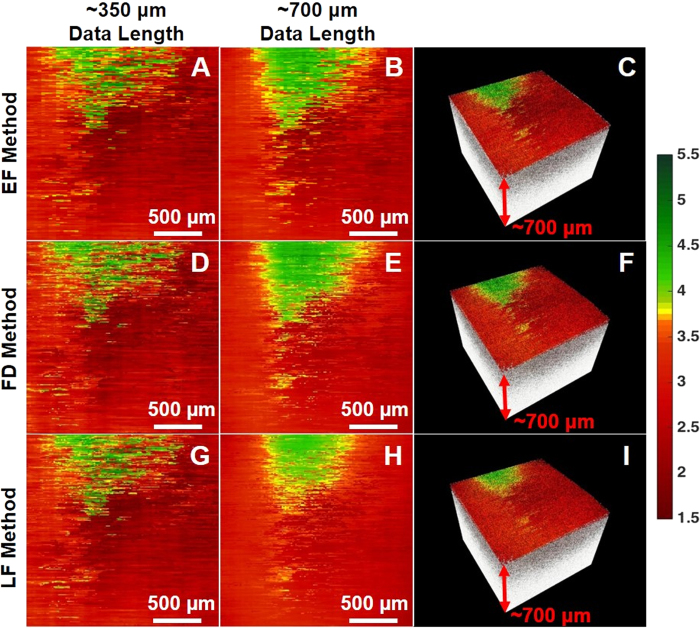
Figure 2.
Color-coded OCT attenuation maps calculated for a silica phantom S using (A to C) the EF method, (D to F) the FD method, (G to I) the LF method. The colormaps were obtained by using a data length of (A,D,G) ∼350 μm and (B,C,E,F,H,I) ∼700 μm in the z direction, respectively; each RGB pixel represents the attenuation coefficient with ∼330 A-lines averaged laterally, and a step size of ∼13 A-lines. (C,F,I) The corresponding volumetric OCT image with an overlaid attenuation en face colormap. Color bar (units in mm−1): green represents high attenuation and red represents low attenuation.

